
2.6. Quickstart#
This is the shortest complete pyCSAMT workflow: load a bundled EDI survey, confirm what was read, normalize it for processing, and save one diagnostic figure. It assumes pyCSAMT is already installed. See Install pyCSAMT if the import or command-line verification has not succeeded yet.
The example uses the WILLY L18PLT AMT line shipped with the source repository. When working from an installed wheel, replace the bundled path with your own EDI directory. For AVG, J-format, spectra, time-series, TEM/TDEM, or Stratagem inputs, choose the correct route in Identify your data format first.
2.6.1. Load and inspect#
Run these commands from the repository root:
>>> from pycsamt.api import read_edis
>>> survey = read_edis(
...     "data/AMT/WILLY_DATA/L18PLT",
...     recursive=False,
...     strict=True,
...     on_dup="replace",
...     progress=False,
... )
>>> survey.n_sites
28
>>> survey.stations[:3]
['23-18-001A', '23-18-002U', '23-18-003A']
>>> len(survey.errors())
0
The expected count is specific to this dataset. For field data, compare it with the survey manifest. Zero parser errors means every discovered file in this call was readable; it does not validate coordinates, units, uncertainty, or transfer-function quality.
The survey inventory gives the fastest structural check:
>>> inventory = survey.summary()
>>> print(inventory)
APIFrame: edi_survey_summary
kind: edi.summary
shape: 28 rows x 6 columns
columns: station, path, n_freq, tipper, spectra, ts
numeric: 1 columns
missing: 0.0%
source: data/AMT/WILLY_DATA/L18PLT
>>> table = inventory.to_pandas(copy=True)
>>> sorted(table["n_freq"].unique().tolist())
[53]
Every station has 53 impedance-frequency rows. The equal counts are useful, but confirm the frequency values themselves before comparing arrays element by element.
2.6.2. Normalize for processing#
The public survey view is convenient for inspection. Electromagnetic
processing functions normalize inputs to pycsamt.site.base.Sites via
pycsamt.emtools.ensure_sites():
>>> from pycsamt.emtools import ensure_sites
>>> sites = ensure_sites(
...     survey.collection,
...     recursive=False,
...     order_by="input",
...     strict=True,
... )
>>> type(sites).__name__, len(sites)
('Sites', 28)
>>> sites[0].name, sites[0].summary()["nfreq"]
('18-001A', 53)
order_by="input" preserves the supplied collection order. It is a safe
starting point only when the file sequence is already meaningful. Coordinate-
derived chainage and other ordering modes are explained in
Configure a first session and Loading electromagnetic data.
2.6.3. Save one diagnostic figure#
The survey fingerprint compares phase-sensitive quantities across station and period. Save it after the inventory checks:
>>> from pathlib import Path
>>> from pycsamt.emtools import plot_survey_fingerprint
>>> output = Path("results/quickstart")
>>> output.mkdir(parents=True, exist_ok=True)
>>> fig = plot_survey_fingerprint(
...     survey.collection,
...     quantities=["skew", "ellipt", "s1"],
...     render="imshow",
...     plot_kws={"interpolation": "bilinear"},
...     station_grid=True,
...     period_range=(1e-4, 1.0),
...     recursive=False,
...     title="L18PLT quick survey fingerprint",
...     figsize=(11.2, 7.6),
... )
>>> target = output / "survey_fingerprint.png"
>>> fig.savefig(target, dpi=180, bbox_inches="tight")
>>> target.as_posix()
'results/quickstart/survey_fingerprint.png'
pcolormesh is the function’s default renderer; this quickstart selects
imshow with bilinear interpolation to match the captured image. The detailed controls for
selecting one or more quantities and overriding panel colormaps are introduced
in Inspect a first survey.
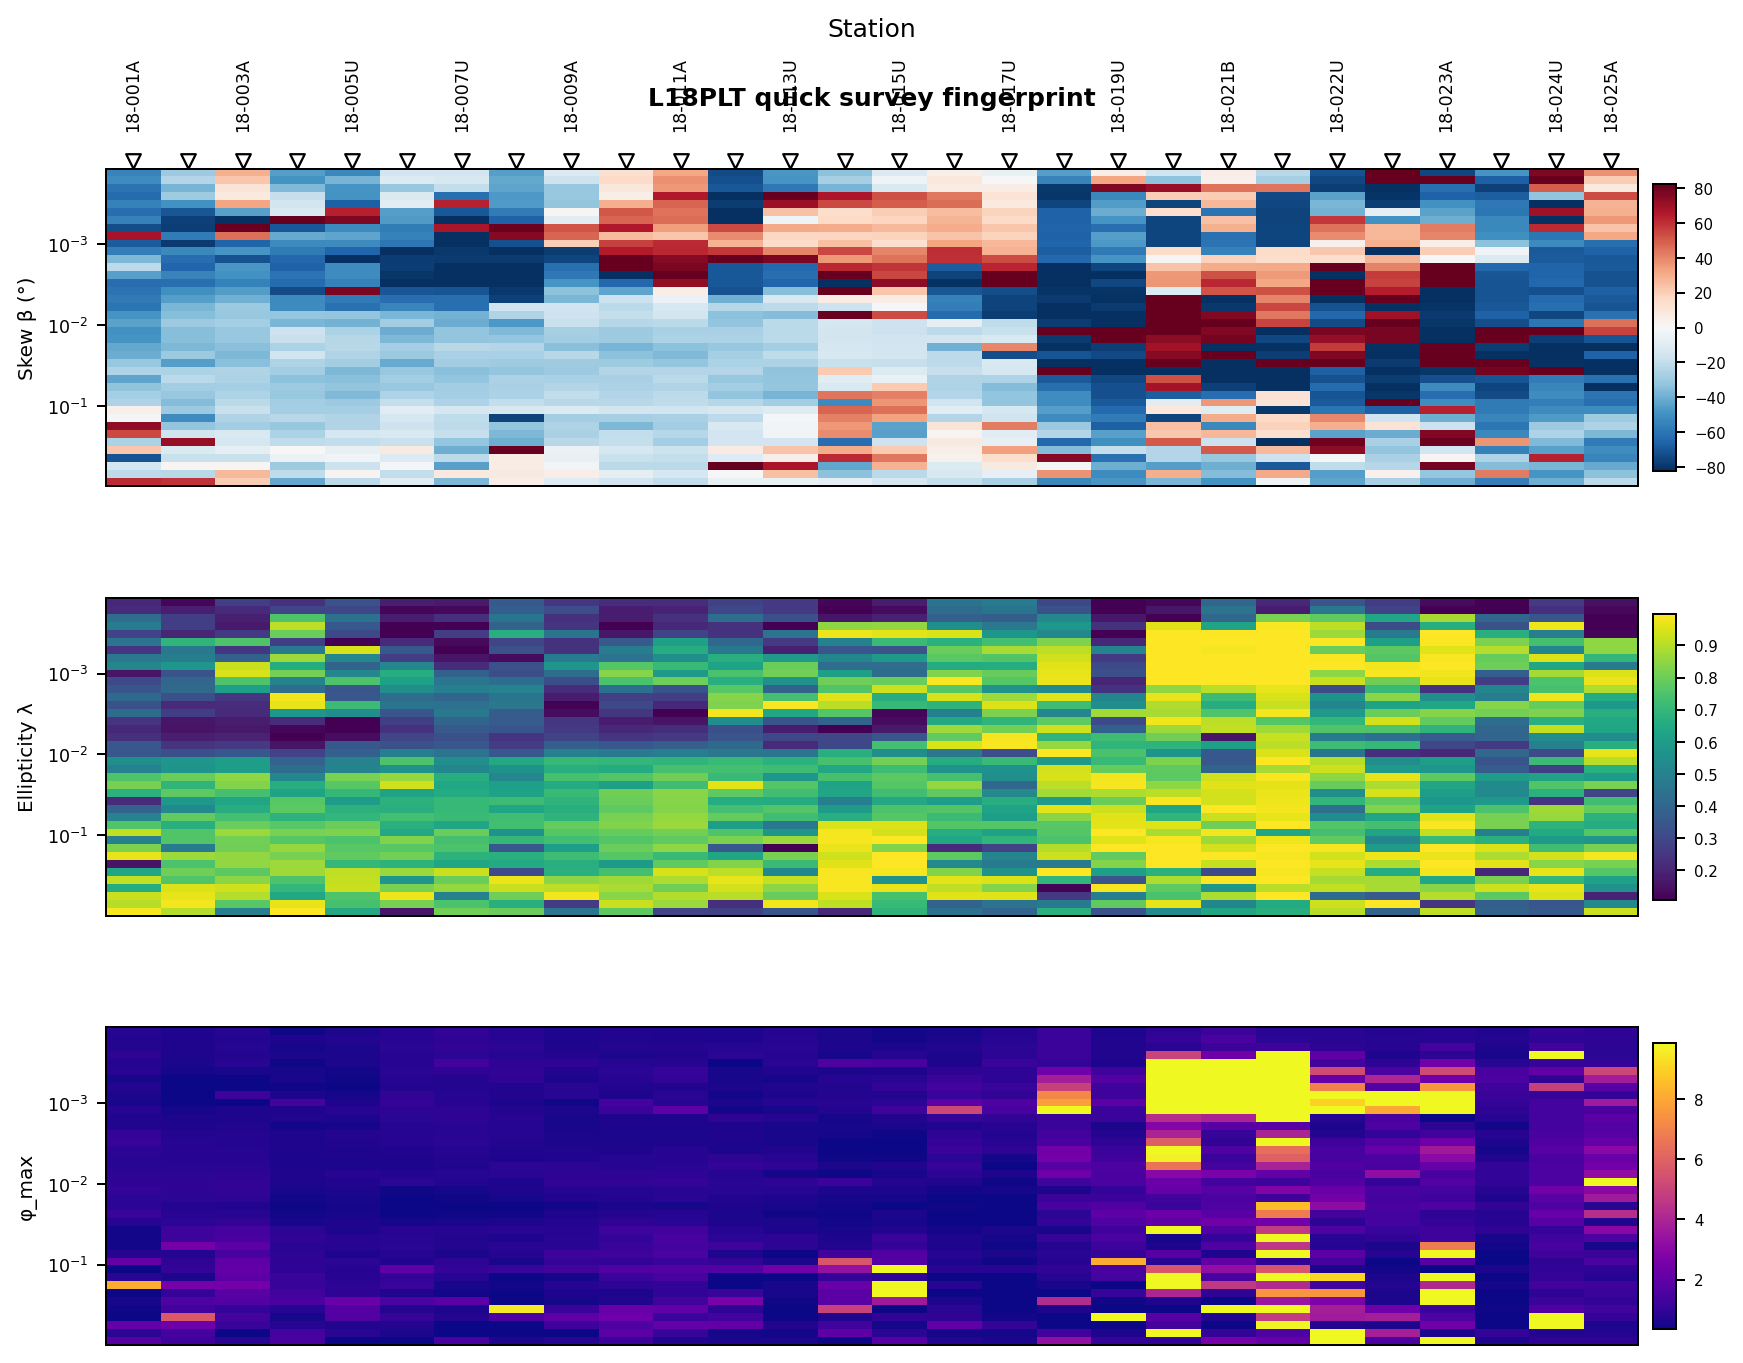
L18PLT phase-sensitive survey fingerprint over periods from \(10^{-4}\) to \(1\) s.#
The latter half of the line contains coherent station-period changes across several panels. That agreement makes the region worth further phase-tensor, strike, noise, and source-effect checks, but it does not by itself identify a geological boundary or justify removing stations.
2.6.4. Complete script#
The complete executable version is kept outside the page so repeated setup and file-writing code does not interrupt the quickstart narrative:
View the complete quickstart scriptClick to inspect and copy the complete code
 1#!/usr/bin/env python
 2# Author: LKouadio <etanoyau@gmail.com>
 3# License: LGPL-3.0
 4"""Run the complete first-survey quickstart and save its fingerprint plot."""
 5
 6from __future__ import annotations
 7
 8import argparse
 9from pathlib import Path
10import sys
11
12import matplotlib
13
14matplotlib.use("Agg")
15
16ROOT = Path(__file__).resolve().parents[2]
17DEFAULT_DATA = ROOT / "data" / "AMT" / "WILLY_DATA" / "L18PLT"
18if str(ROOT) not in sys.path:
19    sys.path.insert(0, str(ROOT))
20
21from pycsamt.api import read_edis  # noqa: E402
22from pycsamt.emtools import ensure_sites, plot_survey_fingerprint  # noqa: E402
23
24
25def run(data_dir: Path, output_dir: Path) -> Path:
26    """Load *data_dir*, print its inventory, and write one diagnostic plot."""
27    survey = read_edis(
28        data_dir,
29        recursive=False,
30        strict=True,
31        on_dup="replace",
32        progress=False,
33    )
34    if survey.errors():
35        raise RuntimeError(f"EDI parser errors: {survey.errors()}")
36
37    inventory = survey.summary().to_pandas(copy=True)
38    print(f"Loaded {survey.n_sites} stations")
39    print(inventory[["station", "n_freq", "tipper"]].head())
40
41    sites = ensure_sites(
42        survey.collection,
43        recursive=False,
44        order_by="input",
45        strict=True,
46    )
47    fig = plot_survey_fingerprint(
48        sites,
49        quantities=["skew", "ellipt", "s1"],
50        render="imshow",
51        plot_kws={"interpolation": "bilinear"},
52        station_grid=True,
53        period_range=(1e-4, 1.0),
54        recursive=False,
55        title="L18PLT quick survey fingerprint",
56        figsize=(11.2, 7.6),
57    )
58
59    output_dir.mkdir(parents=True, exist_ok=True)
60    target = output_dir / "survey_fingerprint.png"
61    fig.savefig(target, dpi=180, bbox_inches="tight")
62    print(f"Saved diagnostic: {target.as_posix()}")
63    return target
64
65
66def main() -> int:
67    parser = argparse.ArgumentParser(description=__doc__)
68    parser.add_argument("--data-dir", type=Path, default=DEFAULT_DATA)
69    parser.add_argument(
70        "--output-dir",
71        type=Path,
72        default=Path("results") / "quickstart",
73    )
74    args = parser.parse_args()
75    run(args.data_dir, args.output_dir)
76    return 0
77
78
79if __name__ == "__main__":
80    raise SystemExit(main())
Run it from the repository root with:
python docs/scripts/quickstart_first_survey.py
The script prints:
Loaded 28 stations
      station  n_freq  tipper
0  23-18-001A      53   False
1  23-18-002U      53   False
2  23-18-003A      53   False
3  23-18-004A      53   False
4  23-18-005U      53   False
Saved diagnostic: results/quickstart/survey_fingerprint.png
Do not proceed solely because this script completes. Verify station identity, coordinates, component availability, frequency alignment, and unexpected diagnostic patterns before correction or inversion.
2.6.5. Continue with the appropriate depth#
Inspect a first survey explains every inventory check and interprets the figure in more detail.
Read an EDI Survey provides a complete EDI-reading tutorial.
Inspect and QC a Survey introduces richer quality-control diagnostics.
EM Tools Guide organizes processing methods and their scientific assumptions.
Inversion helps choose an inversion route only after the observations have been reviewed.