
4.7. Exports And Reproducibility#
The web app produces exported products for two different purposes. Some exports are figures meant for reports, presentations, or quick review. Others are data products, session files, or solver outputs that need to be reused outside the browser. Both are reproducible only when the exported file can be tied back to the loaded survey, the selected lines and stations, the method parameters, the applied correction chain, the pyCSAMT version, and the run log.
The browser is therefore a working surface, not the scientific record by itself. A defensible export has a small provenance story behind it:
where \(E\) is the exported product, \(\mathcal{S}_{page}\) is the selected survey subset, \(\theta\) are the page or tool parameters, \(C\) is the correction chain applied before export, and \(v\) is the software version and runtime context. A screenshot without those ingredients can still be useful for discussion, but it is weaker evidence than a page export, session JSON, and source survey kept together.
4.7.1. Saving Figures#
The web app uses two figure routes, and they should not be treated as identical.
Interactive Plotly figures, such as Map View, 3D Map, and many section views, are browser-rendered objects. Their Plotly modebar includes a camera button that downloads the current view as PNG, and pan, zoom, autoscale, and reset controls that change the framing before export. The numerical traces do not change when you pan or rotate a scene, but the exported PNG does capture the current camera, colour scale, and visible layout. For audit-heavy work, an interactive HTML or figure specification is stronger than a PNG because it preserves the plotted traces and layout, not only pixels.
Matplotlib page figures, such as QC, correction, advanced diagnostics, forward modelling, interpretation, and results plots, are rendered as static images in the app. Where a page provides Export, Export PNG, or a similar button, use that instead of a screen capture. The button writes the figure generated by the package at the requested resolution; a screen capture only records the browser viewport.
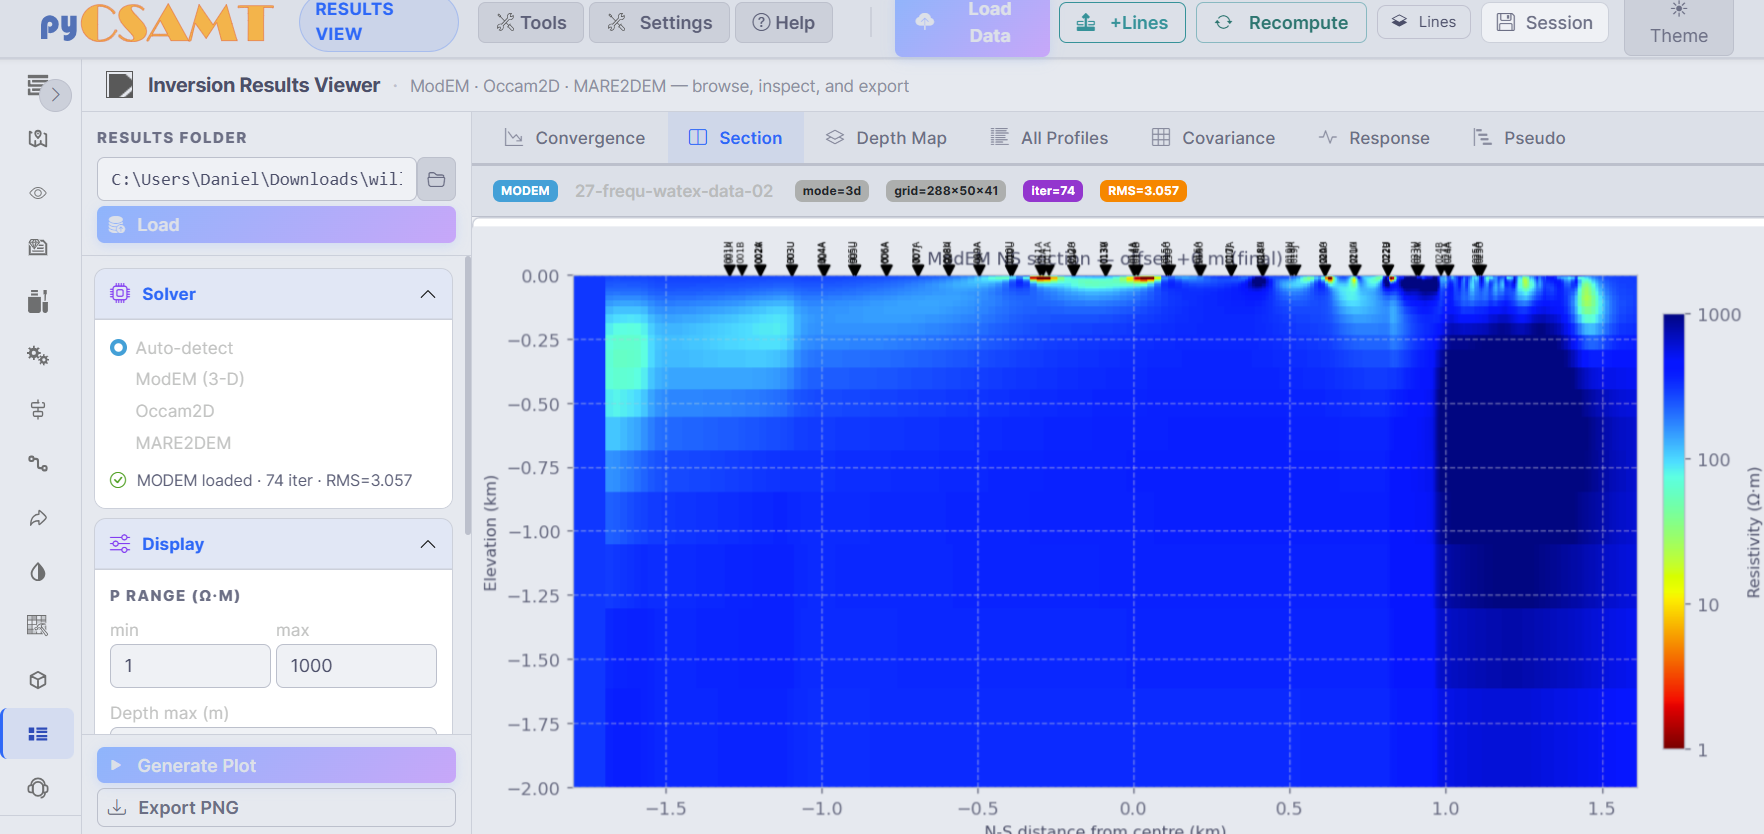
Results View provides an Export PNG action for the figure itself. The surrounding metadata matters too: solver type, iteration count, RMS, depth range, and resistivity limits are part of how the exported section should be interpreted.#
Use static image export when the product must enter a PDF report or slide deck. Keep an interactive HTML, JSON, or source script when reviewers may need to inspect traces, hover values, map camera state, or the exact figure-building options later. Plotly static export may require Kaleido when the export is performed from Python rather than from the browser modebar.
4.7.2. Page And Tool Exports#
Several pages and tools export more than one figure. The table below is a map of what leaves the browser and what should be kept beside it.
Surface |
Export |
Keep with it |
|---|---|---|
Correction page |
Export Corrected Data writes a corrected-data export reflecting the current correction chain. |
Original survey folder, correction method names, parameters, selected lines/stations, and preview notes. |
3D Map page |
The Export panel saves the scene as PNG or standalone interactive HTML. |
Quantity plotted, depth or pseudo-depth settings, colour scale, camera view, and selected lines. |
Results View page |
Export PNG saves the current tab, such as section, convergence, response, or depth map. |
Solver folder, solver type, iteration or response file, RMS, depth range, and resistivity range. |
Interpretation page |
The Export category saves interpretation products. |
Data source, calibrated model or raw/corrected choice, constraints, uncertainty settings, and interpretation parameters. |
Pipeline page |
The Export step writes processed EDI files and products to a chosen output folder. |
Pipeline configuration, thresholds, step status, failed or skipped steps, and output directory. |
Batch Export Plots tool |
Writes many figures in one pass for the loaded survey. |
Batch preset, figure list, common style settings, selected survey subset, and output directory. |
This is the right place to be slightly strict with names. A file called
section.png is easy to lose; a name such as
L34_modem_iter74_rms3p057_section_0-5km.png carries line, solver, run
state, and display depth before anyone opens the file.
4.7.3. Batch Export#
For anything more than a few figures, use Tools -> Batch Export Plots. The batch export route is faster than exporting page by page, but its larger benefit is consistency: the same loaded survey, line selection, style settings, and output directory are used for the whole figure set.
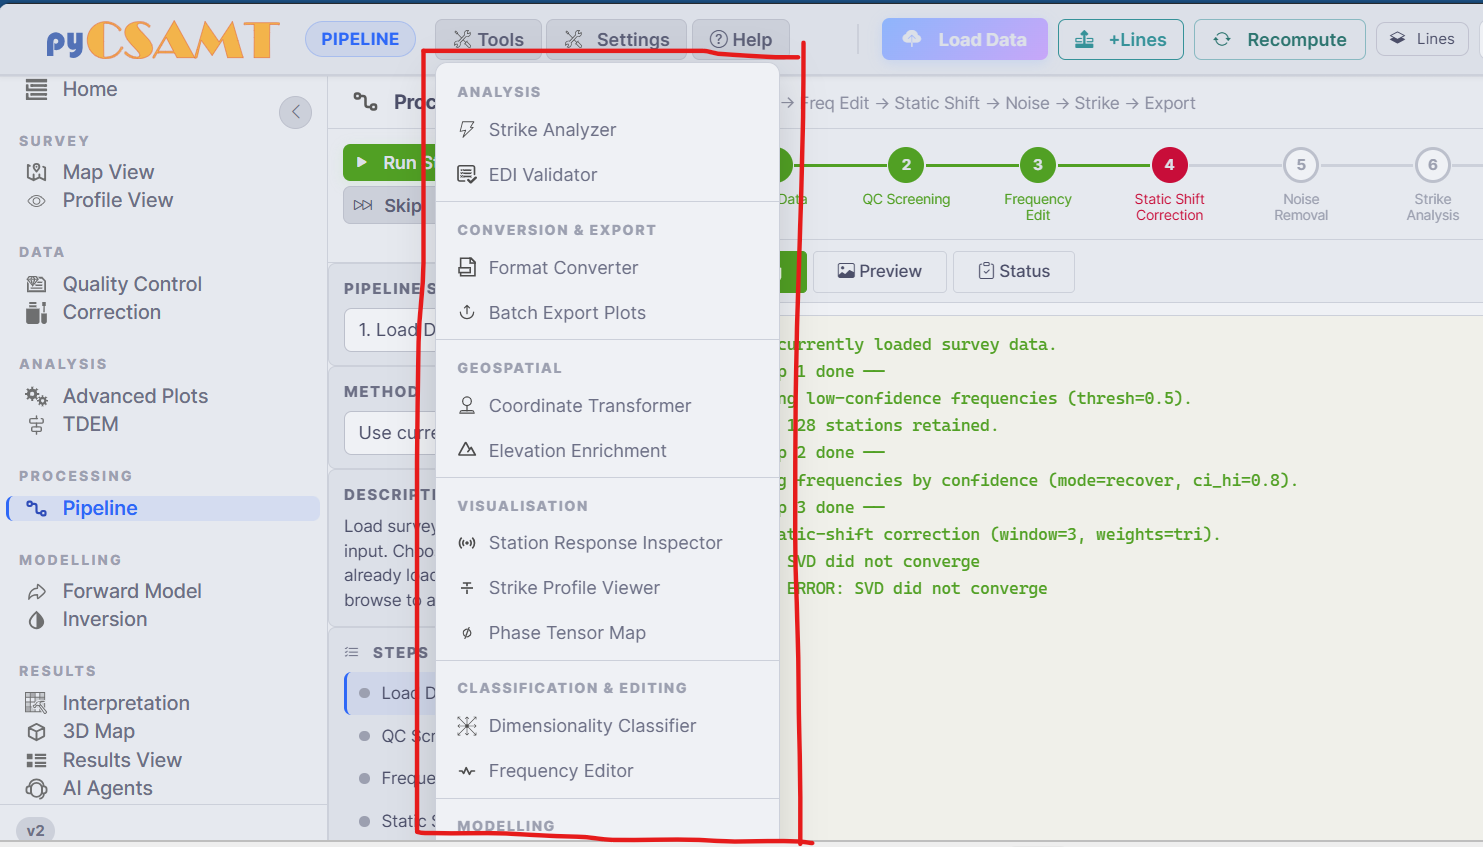
Batch Export Plots lives in the Tools menu. Use it when a report needs a complete, consistently framed figure set rather than a sequence of manual one-off exports.#
Batch export should still be reviewed. A uniform style makes figures easier to compare, but it can also hide page-specific decisions such as a depth limit or frequency band that should be different for one line. Before delivery, scan the full set for blank panels, clipped labels, inconsistent colour limits, and figures whose selected station or line subset no longer matches the report text.
4.7.4. Session Files#
The Session drawer downloads a session JSON that captures browser workflow state and settings. It is the reproducibility anchor for the interactive session:
Download JSON archives the current web session or shares it with a colleague.
Restore Session reopens that state in any browser running the same app.
What is included? lists exactly which state fields are written.
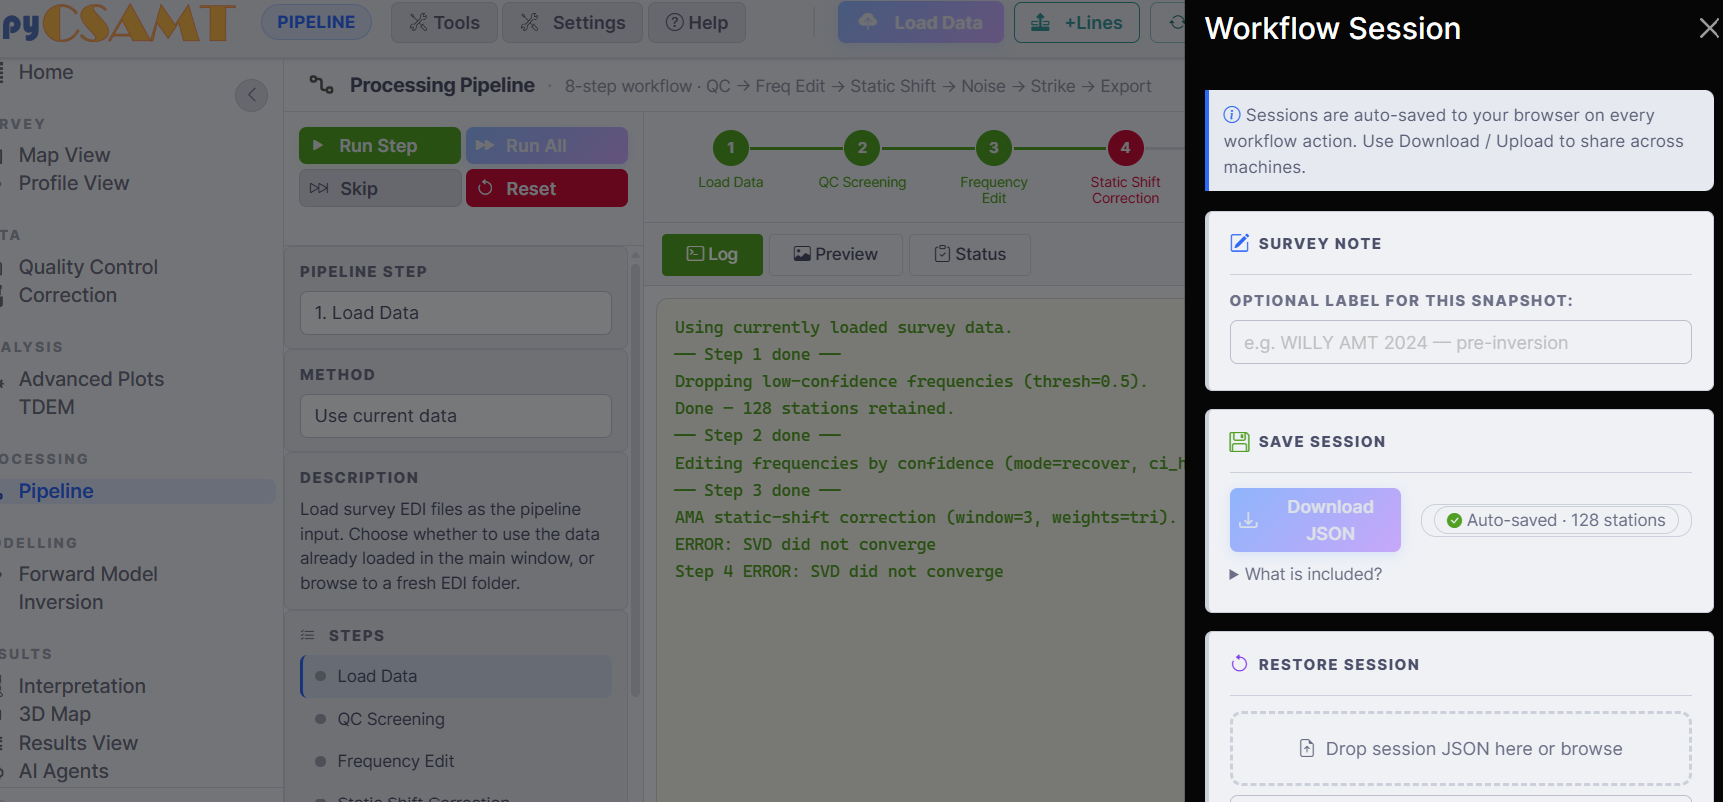
The Session drawer preserves the browser-side workflow state. It helps reconstruct what the reviewer saw, but it does not replace the survey files or external solver folders used to generate the scientific data.#
The session JSON stores workflow state, not raw EDI, AVG, J, or native solver files. Keep the original survey folder alongside the session so the survey can be reloaded when the session is restored on another machine. For a useful bundle, keep at least:
the original survey folder or immutable copy;
the session JSON;
exported figures or data products;
the selected pipeline or correction parameters;
any external inversion result folder used by Results View;
a short export manifest or README describing what was exported.
The Settings drawer can also download configuration for computation
defaults and provider settings. API keys are different: an API key is a
secret and is deliberately not part of shared exports. In the web app,
LLM provider keys live in browser localStorage so each user enters their
own key in Settings; see Navigation And Layout.
4.7.5. Reproducing Web Output In Python#
The web app delegates to the package, so web output can be regenerated in code when the same inputs and parameters are available. The common mappings are:
interactive maps, profiles, pseudosections, and 3-D scenes correspond to the
pycsamt.mapfacade;corrections from the Correction page correspond to the same correction catalogue used by Python workflows;
the Pipeline page mirrors the scripted
load -> QC -> edit -> correct -> strike -> exportworkflow;Results View reads native files and solver outputs such as response files, iteration files, covariance settings, and final models;
interpretation exports should be reproducible from the model, constraints, evidence tables, and configuration used to generate them.
For a figure export, the reproducibility target is not only “same image”. It is “same data, same transformation, same display choices.” If a reproduced section has the same model but a different colour scale, it may tell a different visual story. Record both the numerical source and the display parameters.
4.7.6. Practical Export Habits#
Prefer the page’s Export button over a screenshot. Use modebar PNGs for quick visual snapshots, and page exports or scripted exports for report figures. Keep raw data, session JSON, exports, and any solver result folders in one project bundle. Name exported files with line, quantity, method, and important settings. For full report sets, use Batch Export Plots, then review the generated images as a set before delivery.
When an export is used as evidence in an interpretation package, make the link back to source explicit. At minimum, a reviewer should be able to answer: which survey was loaded, which stations were active, which correction chain was applied, which model or solver run was used, what display limits were chosen, and where the product was written.
4.7.7. Next Steps#
Deployment Notes – where exports and uploads live when the app is shared.
Troubleshooting – when an export or download does not appear.