
3.3. Loading Data And Sessions#
The desktop app keeps one active survey session at a time. Loading data
creates the in-memory pycsamt.site.Sites collection that feeds the
station table, survey overview, profile viewer, map viewer, QC dashboard,
correction tools, forward modelling, inversion setup, and agent workflows.
3.3.1. Why Loading Is A Scientific Step#
Loading is the first quality-control decision in the desktop workflow. A wrong folder, mixed survey lines, missing coordinates, or an unexpected file format can affect every plot and export that follows. The desktop therefore treats loading as a visible session step instead of silently accepting paths and moving on.
Before running QC or corrections, use the loading result to answer three questions:
Did I load the intended survey unit? The station count and line labels should match the field folder or project note.
Can the stations be placed in space? Coordinates and elevation should be present enough for maps, profiles, topography, and inversion geometry.
Is there enough frequency coverage for the task? Empty or very short frequency vectors should be investigated before response plots are trusted.
If any answer is uncertain, fix loading first. It is easier to correct a file selection problem before the same bad state has been used by maps, corrections, exports, and inversion setup.
3.3.2. Open Survey Data#
Use Open / Load EDI… from the toolbar or File > Open / Load EDI… from the menu. The dialog is named Open Survey Data because it is the front door for compatible survey files, not only a single EDI file picker.
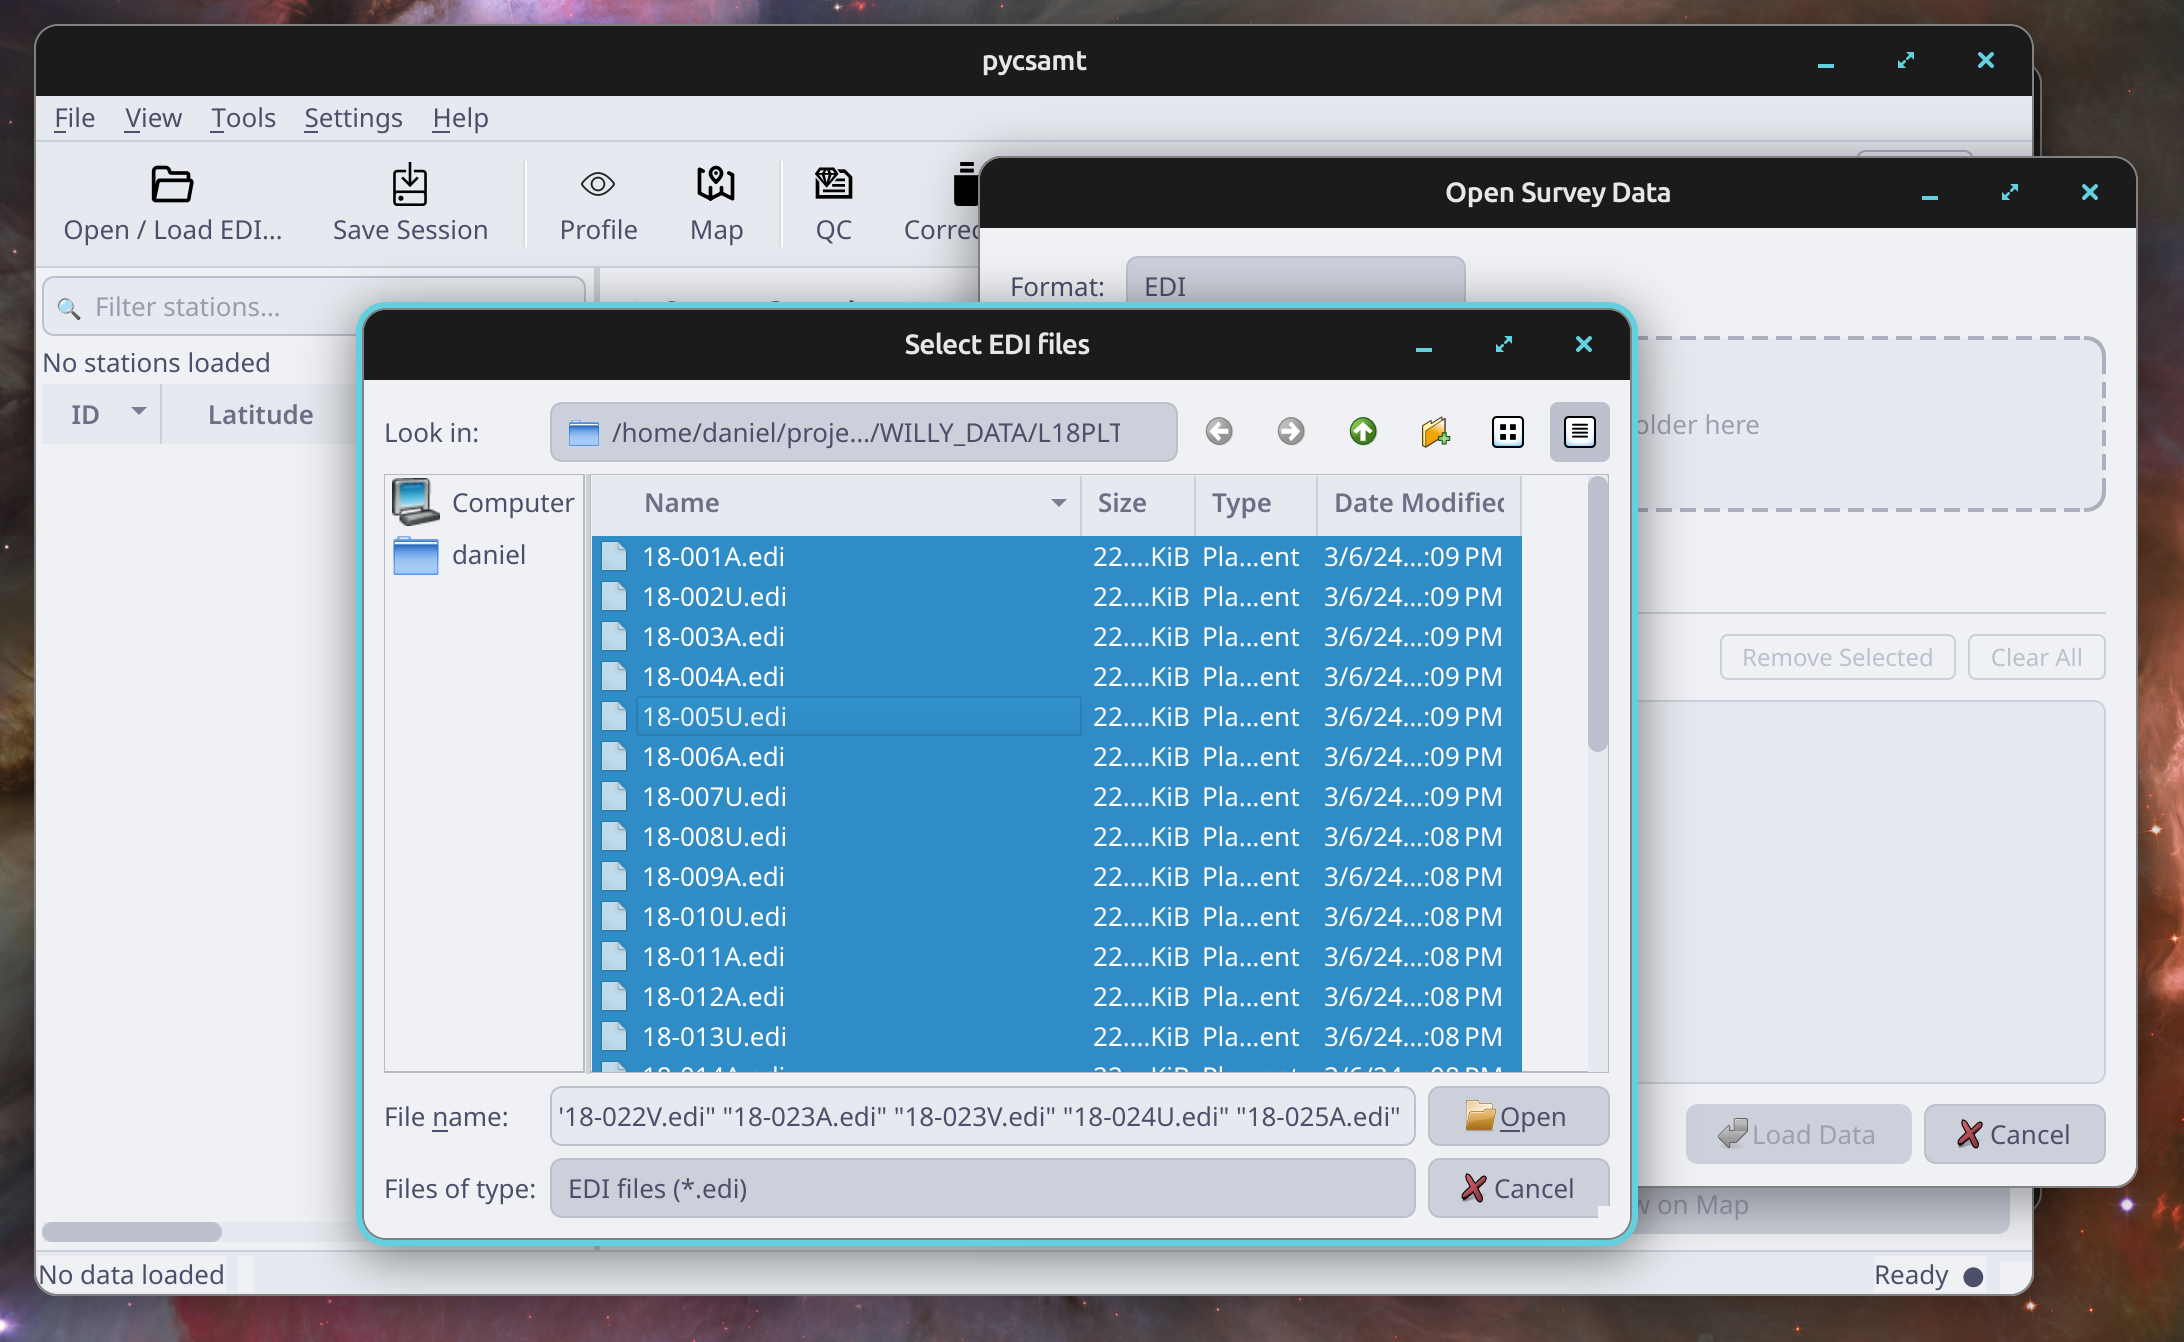
Selecting multiple EDI files from one survey-line folder before loading.#
The loader offers four format filters:
Format |
File pattern |
Typical use |
|---|---|---|
|
|
Standard MT, AMT, and CSAMT station transfer-function files. |
|
|
Zonge AVG inputs that may be converted through desktop tools. |
|
|
J-format or ModEM-style transfer-function sources. |
|
|
Mixed folders when you want the dialog to collect all compatible files. |
3.3.3. Choose Files Or Folders#
There are three normal ways to populate the file list:
Browse Files… opens a multi-select file dialog for the active format.
Browse Folder… scans the selected folder recursively and adds matching files.
Drag files or folders onto the drop zone; folders are recursively searched with the same active format filter.
The dialog keeps the selection visible before any data are loaded. Use Remove Selected to drop individual paths or Clear All to restart the selection. Load Data stays disabled until at least one compatible file is selected.
You can use Browse Files, Browse Folder, or drag and drop repeatedly to build one selection; duplicate file paths are ignored. When a survey is already loaded, Add to current survey is selected by default. Press Add Data to append new stations and lines while retaining existing in-memory data. New lines become active alongside the current line selection.
Station IDs are matched without regard to case. Matching IDs are skipped and reported in the status bar and log; the existing stations are kept. Use unique station IDs when different survey lines contain distinct stations with the same name. To start over, explicitly choose Replace current survey. A failed load leaves the current survey intact. The Load Recomputed EDIs shortcut selects replacement because recomputed files reuse station IDs.
Read the file list before pressing Load Data. It is the last moment where you can catch a wrong folder, duplicated files, or an accidental mix of survey lines without affecting the active desktop session. For a careful first pass, the selected paths should usually share the same survey campaign, line folder, and file format.
For line-based surveys, load one line folder at a time when you want the desktop views to stay focused on a single profile. In the WILLY example data, that usually means opening one of these folders:
data/AMT/WILLY_DATA/L18PLT
data/AMT/WILLY_DATA/L22PLT
data/AMT/WILLY_DATA/L26PLT
data/AMT/WILLY_DATA/L30PLT
data/AMT/WILLY_DATA/L34PLT
For a quick inspection pass, loading a parent folder is acceptable; the dialog will recurse and collect matching files. For interpretation, correction, and inversion preparation, a single survey line is usually easier to review and less noisy in the station table.
3.3.4. Common Selection Mistakes#
The loader is flexible, so users should be deliberate about what goes into the active survey:
Mistake |
Symptom After Loading |
Better Action |
|---|---|---|
Selecting a parent campaign folder for inversion prep |
Several lines appear together, map geometry is crowded, and profile order is hard to interpret. |
Reload the exact line or station group intended for the inversion. |
Mixing raw and corrected EDIs |
Duplicate station IDs or inconsistent response curves appear. |
Keep raw, corrected, and recomputed EDIs in separate folders and load only one data state at a time. |
Loading a folder with old temporary files |
Station count is larger than expected or includes test stations. |
Use Remove Selected or load from a clean project folder. |
Mixing EDI, AVG, and J files during first review |
The active survey may represent different source assumptions or conversion stages. |
Start with one format; convert or compare formats as a separate task. |
Trusting recent files for a changed line folder |
New or removed station files are not obvious from memory. |
Reopen the folder through Open / Load EDI… and verify the file list again. |
3.3.5. Choosing The Right Loading Scope#
Different tasks need different loading scopes:
Task |
Recommended Scope |
Reason |
|---|---|---|
First look at a campaign |
Parent folder or several line folders |
Useful for discovering what files exist and whether metadata are broadly consistent. |
Station-level QC |
One coherent survey line |
Keeps neighbouring stations meaningful when comparing curves and identifying local outliers. |
Static-shift review |
One line or one geologically consistent group |
Corrections need local context; mixed lines can hide or exaggerate shifts. |
Inversion preparation |
The exact line or station group intended for the solver |
Input folders should be built from a clearly reviewed data state. |
Export for reporting |
The same scope described in the report |
Figures, metadata, and corrected EDIs should match the stated survey unit. |
3.3.6. What Happens During Loading#
When you confirm the dialog, the desktop starts a background loader so the window remains responsive. The status bar and progress bar show loading progress while pyCSAMT parses the files.
For EDI data, the loader builds a pycsamt.site.Sites collection and a
station table with these fields:
Column |
Meaning |
|---|---|
|
Station identifier, normally derived from the EDI station name. |
|
Survey-line label when a line mapping is available. |
|
Station coordinates read from file metadata. |
|
Station elevation, when available. |
|
Number of frequency samples in the loaded transfer function. |
|
Whether tipper information is present. |
After a successful load, the same survey object is sent to the profile, map, QC, correction, advanced tools, forward, inversion, interpretation, pipeline, and agent windows. This keeps the desktop session coherent: selecting a station in the table updates the detail card, profile actions, map actions, and downstream workflow panels.
3.3.7. How To Read The First Loaded State#
The first loaded state tells you whether the session is safe to continue. Use the main window before opening processing tools:
Signal |
Healthy State |
Warning State |
|---|---|---|
Station count |
Matches the expected line folder or field sheet. |
Too few stations, duplicate names, or a count that matches a parent folder rather than one line. |
Coordinates |
Latitude/longitude or projected coordinates fall in the expected area. |
Zeros, missing values, swapped axes, wrong hemisphere, or impossible ranges. |
Elevation |
Present and smoothly varying enough for profile/topography work. |
Missing values, large spikes, or values inconsistent with the survey terrain. |
Frequency count |
Most stations have enough samples for the intended QC or inversion task. |
Zero counts, very short bands, or large station-to-station differences. |
Tipper |
Availability matches the field acquisition and planned diagnostics. |
Expected tipper data are absent, or only some stations have it. |
Log/status |
Loader reports success and the active data state is clear. |
Warnings, skipped files, parsing errors, or an unclear active state. |
If two or more warning states appear, stop and inspect the input folder before processing. Reloading clean data is faster than explaining later why a correction, figure, or inversion was built from the wrong active survey.
3.3.8. Station Search And Selection#
The station table search box filters visible stations by text. Use it to quickly isolate a station number, line label, or naming pattern before opening profile and map views.
When a station is selected, the detail panel shows coordinates, elevation, frequency coverage, period range, tipper availability, and a compact quality indicator. The Open Profile and Show on Map actions become available once the station has enough data for those views.
Use selection as a quick sampling strategy. After loading, select:
the first station in the line;
one station near the middle;
the last station in the line;
any station with missing metadata or unusual frequency count;
any station whose name or location looks unfamiliar.
Open the profile and map from those selections before running QC. This gives you a human check of the line geometry and station response before automated diagnostics summarize the same data.
3.3.9. Recent Files#
Every path accepted by the loader is added to File > Recent Files. The recent list is capped by the desktop preferences and is restored when the app restarts. Selecting an entry from the menu reloads that path directly.
Recent files are most useful for single-file checks and small station groups. For full survey lines, prefer Open / Load EDI… and reload the folder so new or removed files are picked up consistently.
3.3.10. Save And Restore The Desktop Session#
Use Save Session to persist the desktop UI state. The session file is stored at:
~/.pycsamt/session.json
The session stores desktop preferences and layout information, including:
theme;
recent files;
last data directory;
selected station;
frequency range settings;
overlay choice;
main-window geometry and dock state;
per-window geometry for profile, map, QC, agent, inversion, and other tool windows;
configured solver paths, default inversion working directory, logging level, tile provider, and API key if entered in preferences.
The session does not replace the survey files themselves. Keep the original EDI, AVG, or J files in a stable project folder; the desktop session stores where you worked and how the interface was arranged, while the scientific data remain on disk.
3.3.11. What The Session Does Not Save#
The saved session is a convenience record, not a scientific archive. It does not embed every input file, corrected output, plot, or inversion product. Use explicit exports when you need a durable record.
For reproducible work, keep these items in your project folder:
original input files;
corrected or recomputed EDIs;
exported figures and tables;
pipeline JSON or processing notes;
inversion input and output folders;
any report or interpretation package sent to another user.
The session helps you return to the same desktop layout. The exported files help another user reproduce or review the scientific result.
3.3.12. Loading Recomputed EDIs#
If the desktop has just run an EDI recomputation workflow, the open-data dialog
can expose a Load Recomputed EDIs shortcut. That button loads all
*.edi files from the last recomputation output folder without manual
navigation.
Use this flow when you have rotated, filtered, filled, or rewritten stations and want the corrected files to become the active desktop survey. After the load completes, the station table and downstream tools operate on the recomputed EDI set.
Treat recomputed EDIs as a new data state. Before continuing:
confirm the output folder name describes the transformation;
compare the station count with the raw input;
open one representative station profile;
check that the intended frequency limits, rotation, or fill operation is visible in the data;
save or export the manifest when the recompute tool produced one.
Do not mix recomputed EDIs with the original raw EDIs in the same load unless the purpose is explicitly to compare data states. For normal processing, load one state, inspect it, and export from that state.
3.3.13. When To Reload Instead Of Continue#
Reload the survey before processing when:
the wrong line or campaign folder was selected;
station IDs are duplicated or unexpected;
coordinates are missing for stations that should map;
the map view places stations far from the expected area;
the profile viewer shows empty curves for several stations;
recent files point to a stale or temporary folder;
the active state is unclear after a correction or recomputation.
Continuing from an uncertain load usually creates more work. The desktop workflow is designed so reloading is cheap and visible; use that to keep later QC, corrections, exports, and inversion inputs trustworthy.
3.3.14. Practical Loading Checklist#
Before starting QC, correction, or inversion setup:
load one coherent survey line or one intentionally mixed survey group;
confirm the station count matches the expected line folder;
scan the station table for missing coordinates or zero frequency counts;
select a representative station and open its profile;
open the map view to confirm station ordering and coordinate sanity;
save the session once the workspace is arranged for the task.