
4.3. Navigation And Layout#
The web app is a single-page application. Every page shares the same shell: a persistent command bar across the top, a collapsible navigation rail on the left, and a content body that swaps as you move between pages. This page explains the shell, the home dashboard, the theme, and the Settings and Help drawers so that the rest of the documentation can refer to them by name.
4.3.1. The App Shell#
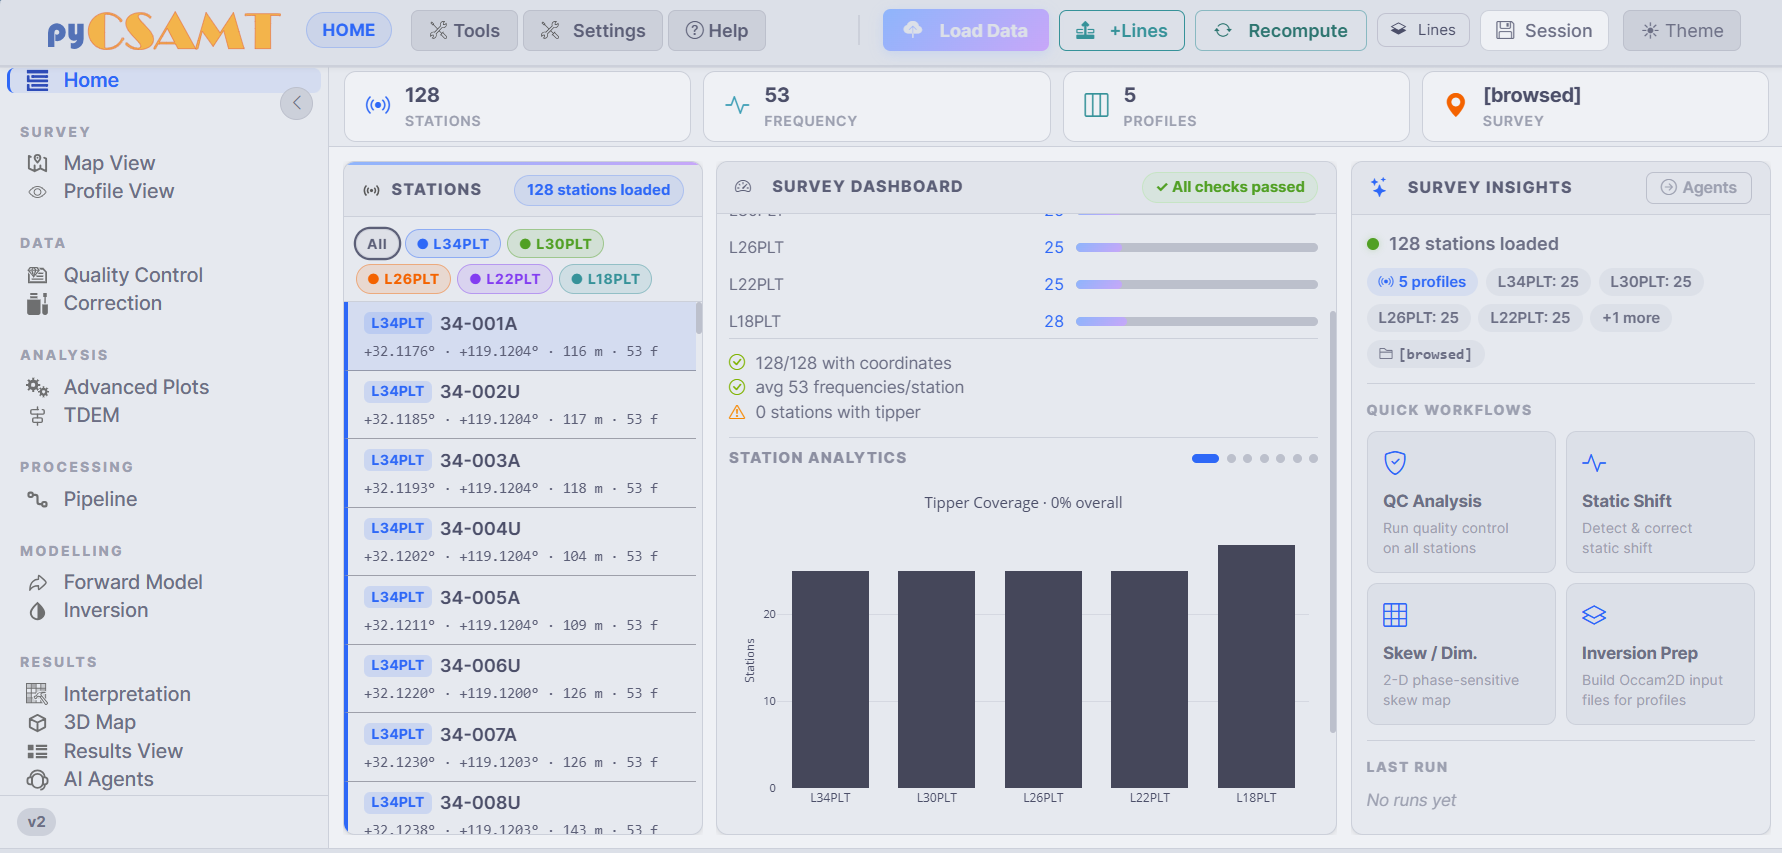
The three persistent zones: the command bar (top), the navigation rail (left), and the content body (centre and right). Here the body is showing the Home dashboard.#
4.3.2. The Command Bar#
The command bar is always visible. It is split into two groups.
On the left, the current page is named (for example HOME or MAP VIEW), followed by three menus that open drawers or dropdowns:
Control |
Opens |
|---|---|
Tools |
A dropdown of standalone utilities — Strike Analyzer, EDI Validator, Format Converter, Batch Export Plots, Coordinate Transformer, Elevation Enrichment, Station Response Inspector, Strike Profile Viewer, Phase Tensor Map, Dimensionality Classifier, Frequency Editor, and more. See Processing Pages. |
Settings |
The Settings drawer: AI provider and API key, model, and computation defaults (see below). |
Help |
The About pyCSAMT dialog with version, license, framework, and feature highlights. |
On the right are the survey actions that operate on the active survey:
Action |
Effect |
|---|---|
Load Data |
Open the loader modal to replace the survey or start a new one. |
+Lines |
Open the loader in Add lines mode to merge more lines into the current survey. |
Recompute |
Recompute apparent resistivity and phase from impedance, optionally with rotation and a frequency band. |
Lines |
Open the Survey Lines drawer to assign, rename, and toggle active lines. |
Session |
Open the Workflow Session drawer to download or restore a session JSON. |
Theme |
Toggle the colour theme. |
All of these survey actions are covered in Loading Data And Sessions.
4.3.3. The Navigation Rail#
The left rail routes between pages. Entries are grouped under short headings that follow the survey workflow:
Home
Survey      → Map View · Profile View
Data        → Quality Control · Correction
Analysis    → Advanced Plots · TDEM
Processing  → Pipeline
Modelling   → Forward Model · Inversion
Results     → Interpretation · 3D Map · Results View · AI Agents
The chevron button at the top of the rail collapses it to an icon-only strip, which widens the plotting area — useful on the map, 3-D, and results pages where the figure benefits from the extra width. The active page is highlighted, and the app version is shown at the bottom of the rail.
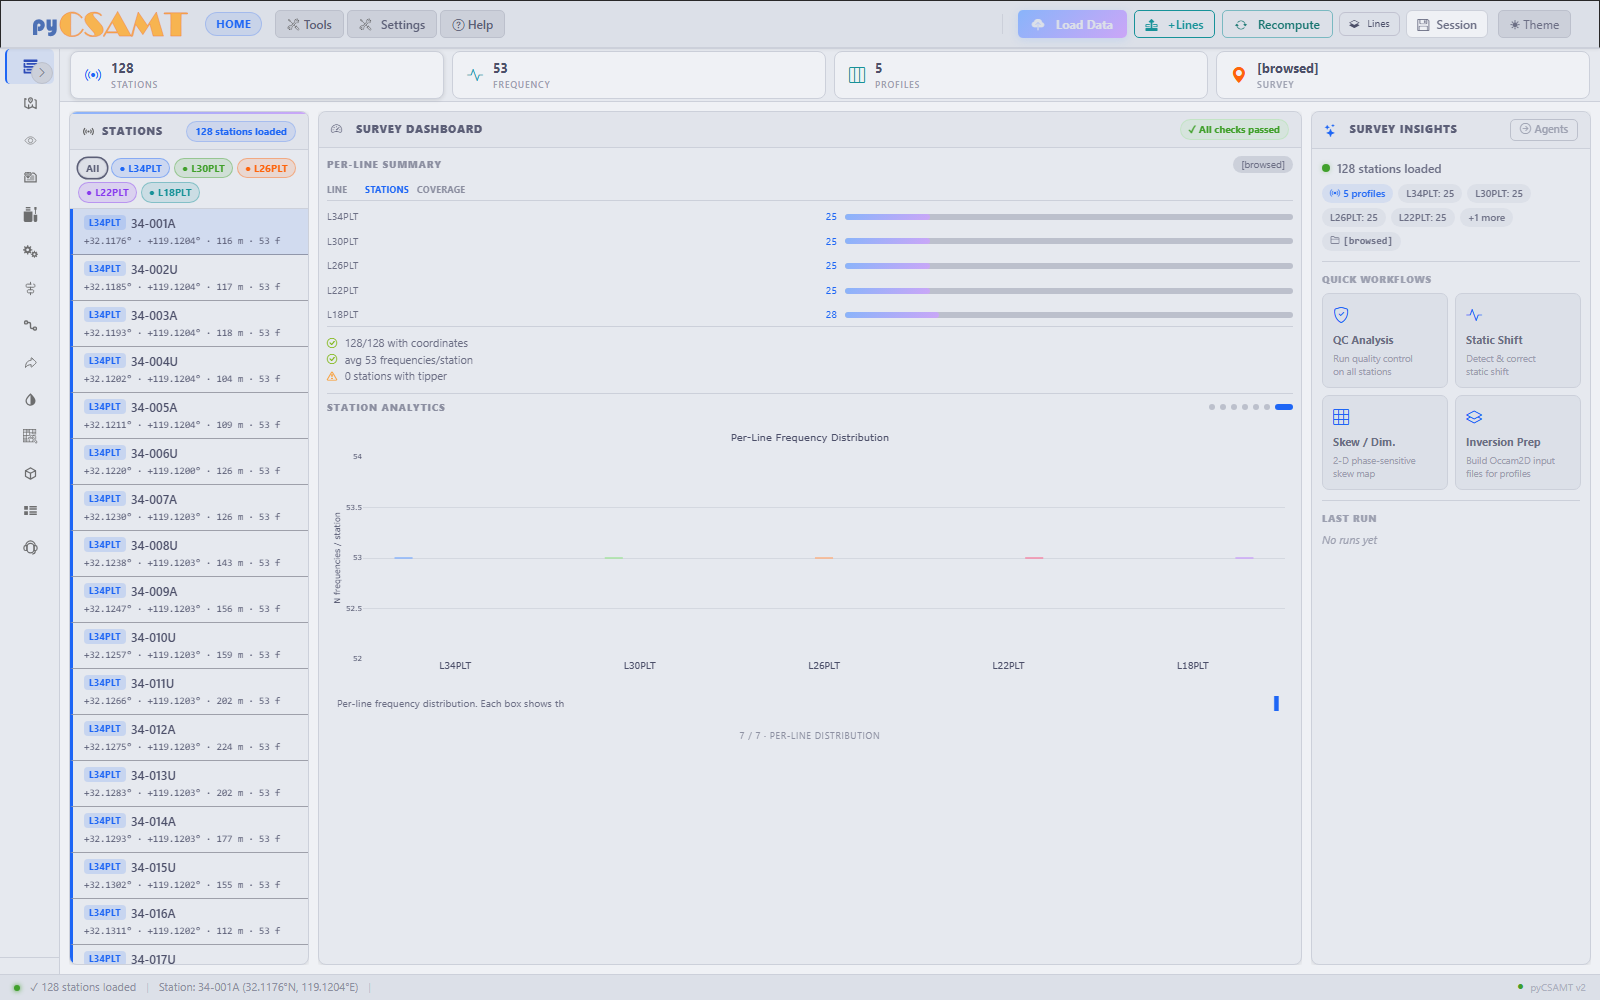
The same session with the rail collapsed. Group headings and page names disappear, group order is preserved as icon stacks, and the freed width goes straight to the content body — here the Home dashboard’s centre column.#
Clicking a rail entry swaps the content body to that page. The active survey, selected station, and line selection persist across pages, so you can move from Map View to Quality Control to Correction without reloading data.
4.3.4. The Home Dashboard#
Home is the landing page after data is loaded. It summarises the survey and offers shortcuts, but does not change any data.
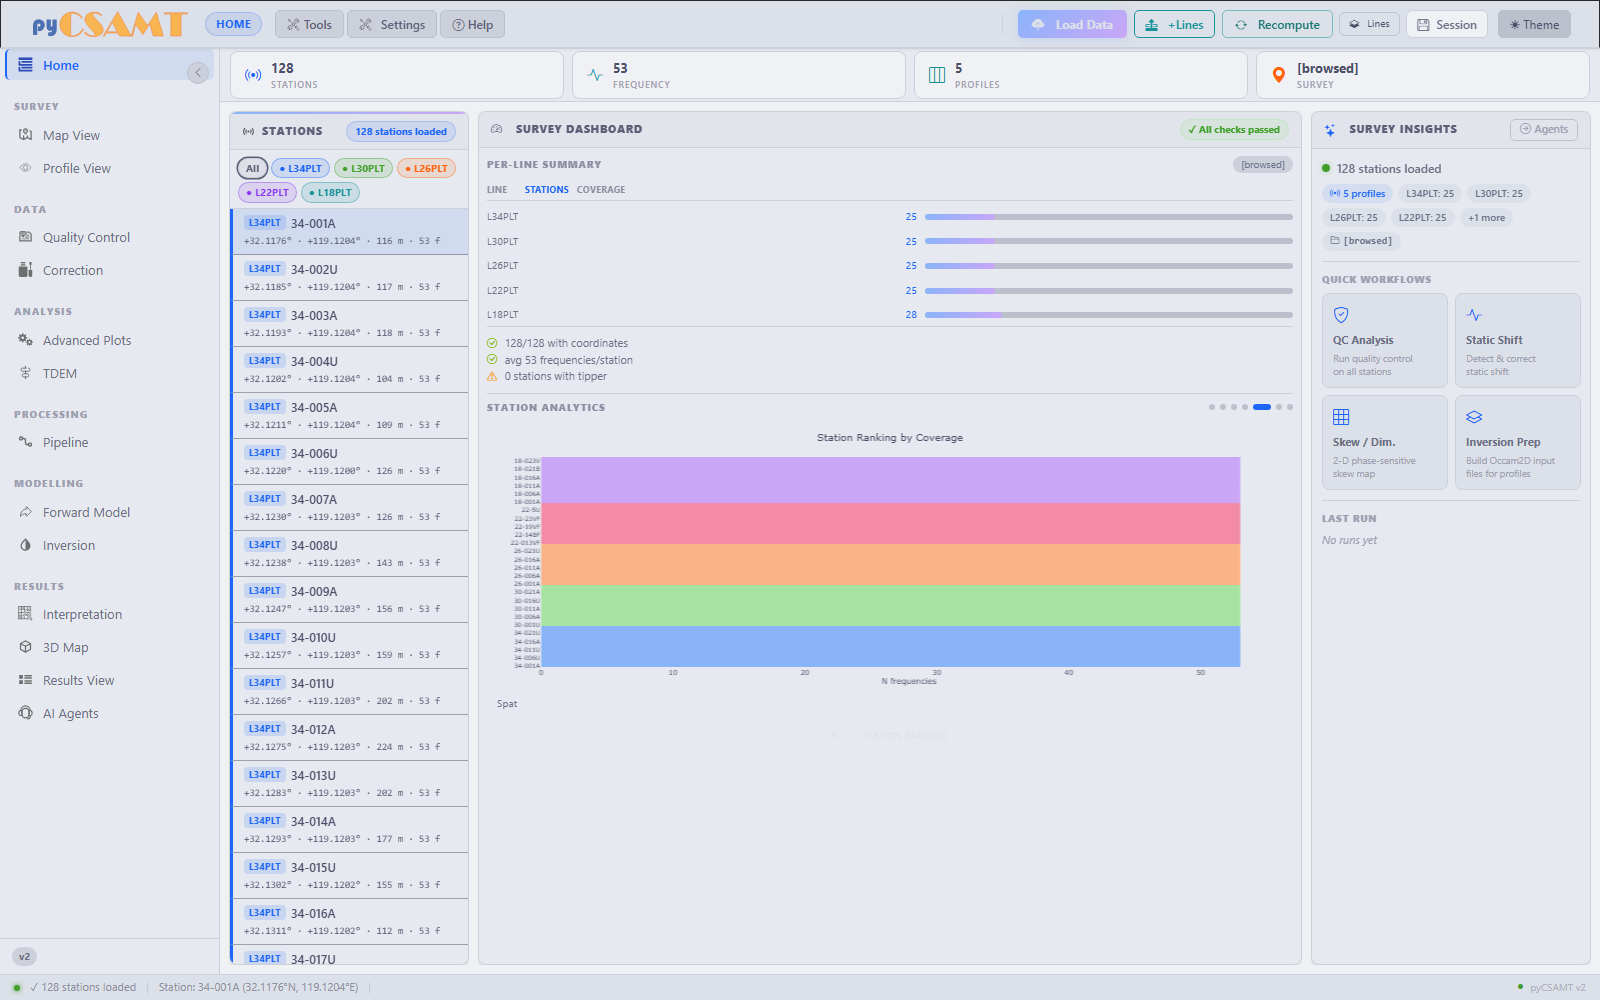
Home with the WILLY AMT survey loaded (128 stations across five profile lines). This is the Station Ranking slide of the analytics carousel; the dot indicators above the chart mark the other six.#
KPI cards across the top report the headline counts: number of stations, number of frequencies, number of profiles (profile lines), and the survey name or source.
The Stations list on the left shows every station with its line tag, coordinates, elevation, and frequency count. Line chips (for example
L34PLT,L30PLT) filter the list to one line; All clears the filter. Selecting a station here syncs it to the map and profile pages.The Survey Dashboard in the centre reports data-health checks — how many stations have coordinates, the average frequencies per station, tipper availability — and a Station Analytics carousel that auto-rotates through seven small summary charts: tipper coverage, frequencies per station, a per-station quality radar, survey geometry, station ranking by coverage, a coverage heatmap, and per-line frequency distribution. Click a dot to jump straight to a slide, or click a station in the list to refresh the quality-radar slide for that station.
Survey Insights on the right lists loaded lines and offers Quick Workflows — one-click shortcuts such as QC Analysis, Static Shift, Skew / Dim., and Inversion Prep — plus a Last Run area and a shortcut to the agents.
Use Home as a preflight: confirm station and frequency counts, that stations have coordinates, and that the expected lines are present before moving into maps, QC, or processing.
4.3.5. Theme#
The Theme button on the command bar toggles the application colour theme. The choice is remembered in the browser, so it persists between sessions on the same machine. Figures follow the app theme where the plotting layer supports it.
4.3.6. Settings Drawer#
The Settings menu opens a right-hand drawer with two groups.
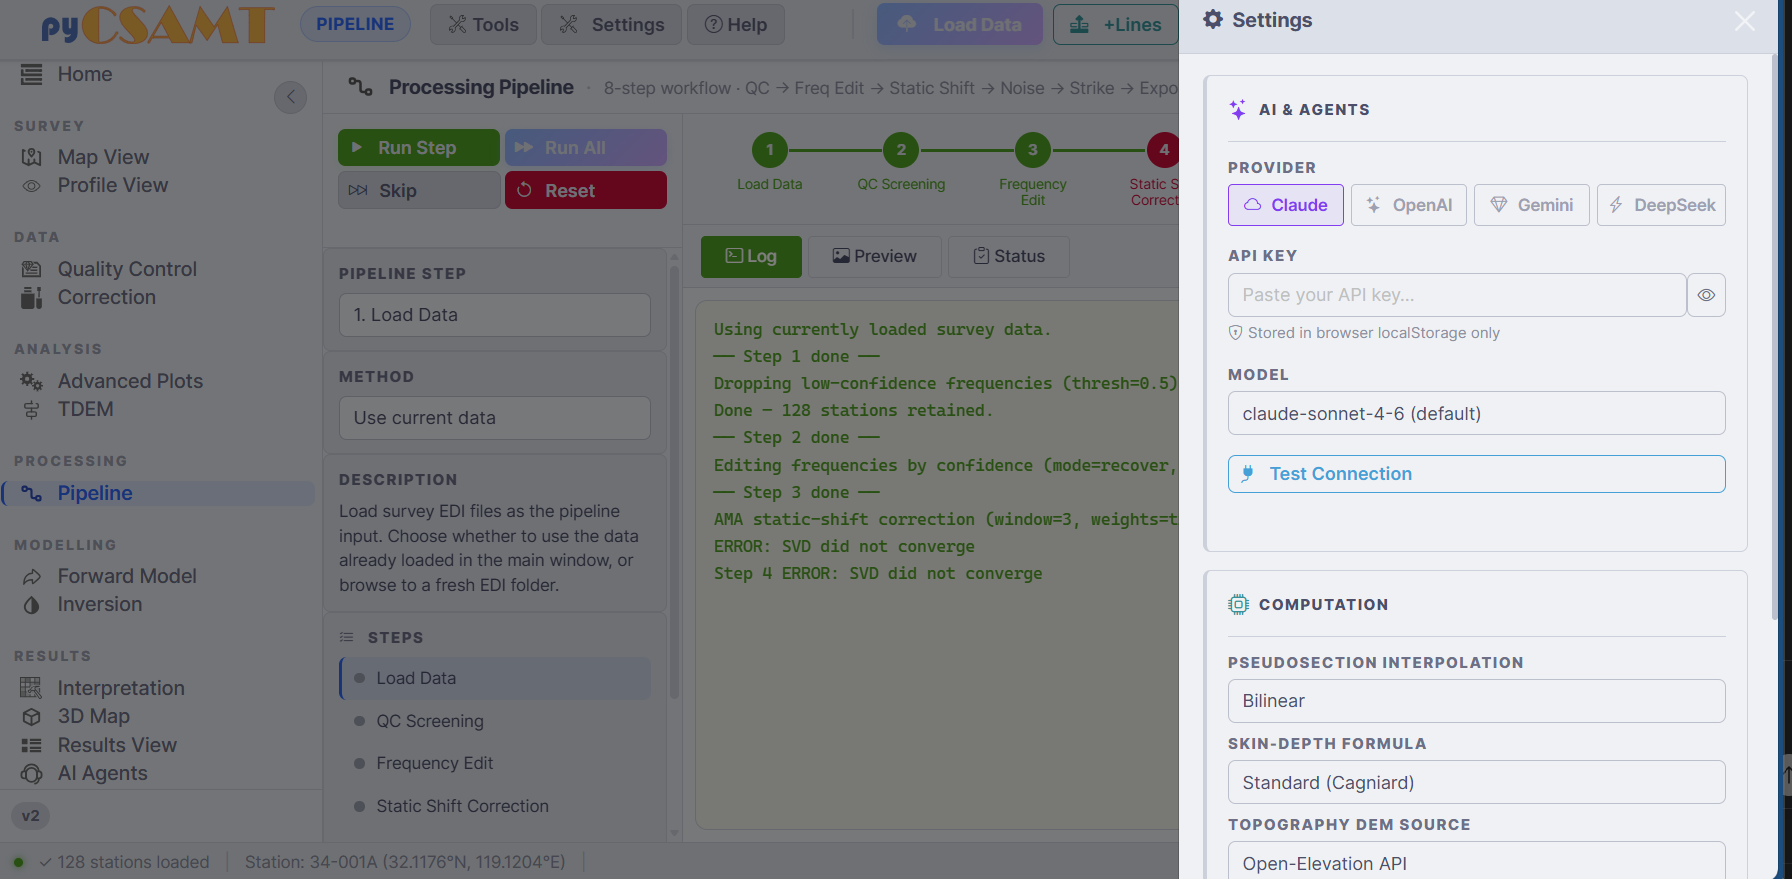
The Settings drawer: AI provider and API key at the top, computation defaults below.#
AI & Agents – choose the LLM provider (Claude, OpenAI, Gemini, or DeepSeek), paste an API key, pick a model, and use Test Connection to verify it. The API key is stored in the browser’s
localStorageonly — it is not written to disk on the server. Agent configuration is used by the AI Agents page and the in-app chat.Computation – defaults that affect how plots and derived quantities are computed, including the pseudosection interpolation method used to grid pseudosections, the skin-depth formula (for example Standard (Cagniard)) behind the skin depth used in section and 3-D pseudo-depth conversions, and the topography DEM source used when elevation enrichment is requested.
4.3.7. Help / About#
The Help menu opens the About pyCSAMT dialog.
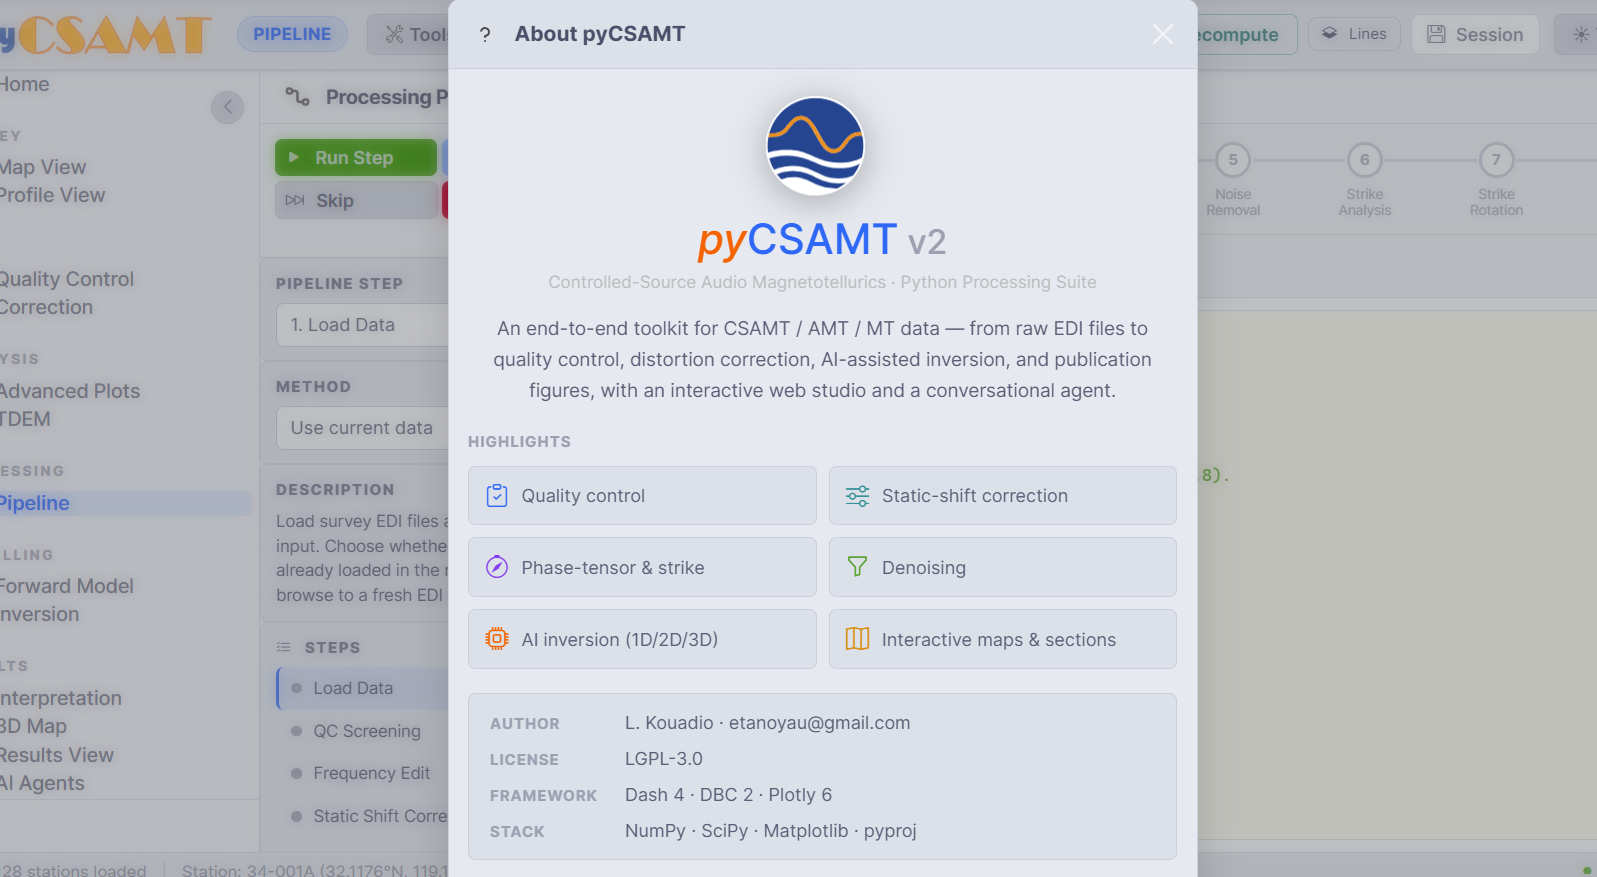
The About dialog. It reports the version, the LGPL-3.0 license, the framework (Dash · DBC · Plotly), the underlying stack, and a summary of capabilities.#
4.3.8. Differences From The Desktop GUI#
The web app and the desktop GUI share the same controllers and produce interchangeable results, but the surfaces differ in a few ways worth knowing:
the web app is a single page with a routed body, where the desktop app uses independent floating windows;
interactive maps and 3-D scenes are Plotly figures in the browser, with a modebar for pan/zoom and PNG snapshots;
AI provider settings and sessions live in the browser, not in a machine profile under
~/.pycsamt;the web app is designed to be shared on a server, so it is the right surface for demonstrations and multi-user review.
4.3.9. Next Steps#
Loading Data And Sessions – load data and manage lines and sessions.
Maps And Profiles – the Map View and Profile View pages.
Processing Pages – QC, correction, modelling, results, and agents.