
4.4. Loading Data And Sessions#
Everything in the web app operates on one active survey (see the Main Concepts table in Overview): every page reads the same loaded data, so getting the load right here is what keeps QC, correction, maps, and modelling consistent with each other later. This page covers how to load that survey from a browser, how to organise it into survey lines, how to recompute transfer functions, and how to save and restore browser sessions.
4.4.1. Loading A Survey#
Open the loader with Load Data on the command bar (or Load EDI Data — Start on the welcome screen). The loader is a modal with two tabs.
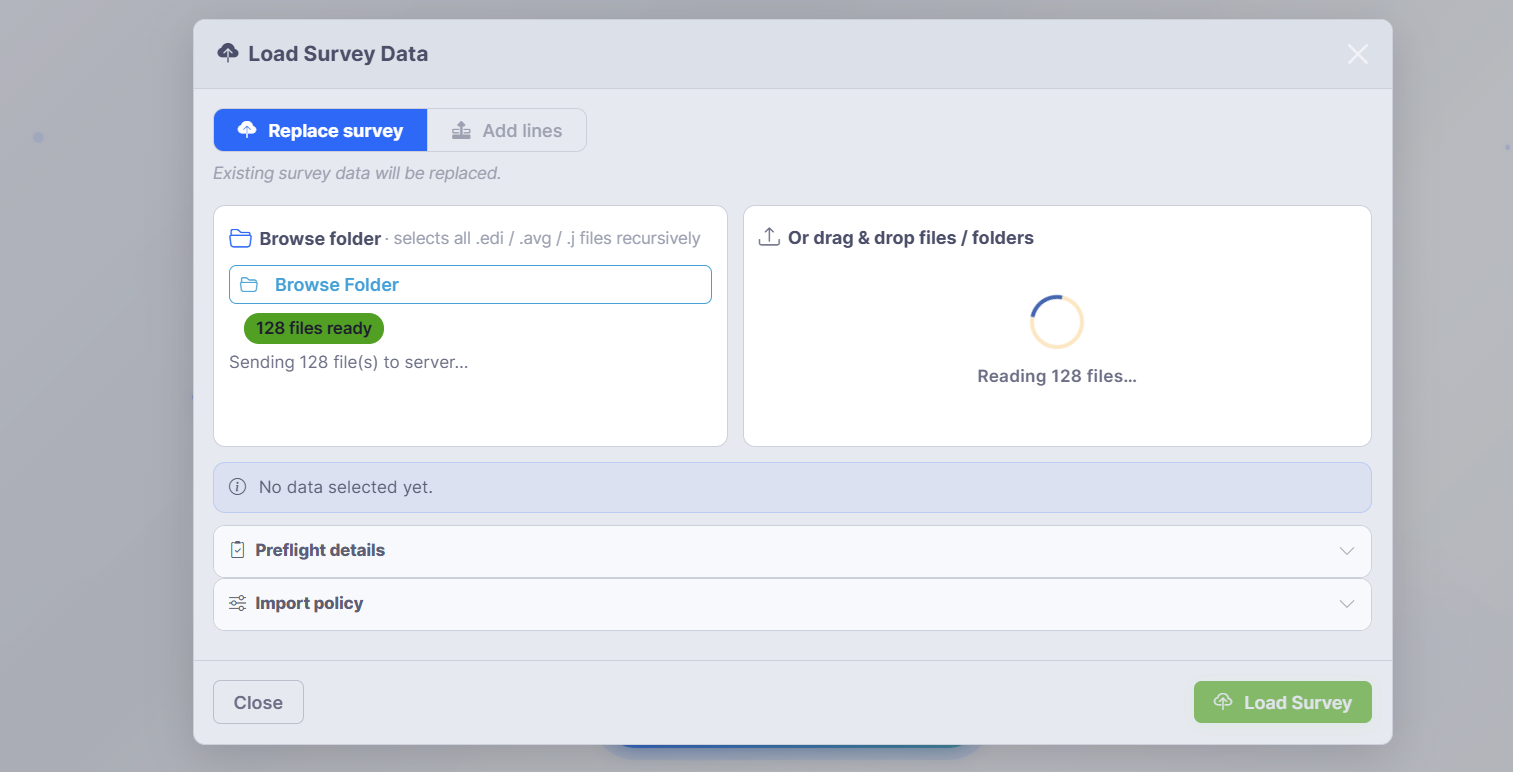
The loader in Replace survey mode. Browse to a folder or drag files in, review the preflight, then click Load Survey.#
Replace survey loads a new survey and replaces whatever is currently loaded.
Add lines merges additional lines into the current survey (covered below).
You provide data in one of two ways:
Browse folder – pick a parent folder. The loader selects every
.edi(EDI),.avg(AVG file), and.j(J-file) file it finds recursively, so pointing at a survey root loads every line at once, whatever format each field day happened to export.Drag & drop – drop files or whole folders onto the drop zone. The same file types are accepted.
Two collapsible sections give you control and confidence before committing:
Preflight details – a summary of what was found (file counts, detected lines, station totals) so you can confirm the selection before loading.
Import policy – options that govern how files are interpreted and merged.
Click Load Survey to load. The status area reports progress (Reading … files, Parsing … files) and finishes with a summary such as Loaded 128 stations from 5 lines. After loading, the app shows the Home dashboard with the survey in place.
Tip
Organise field data as one folder per survey line before loading. The line manager then picks up each subfolder as a named line automatically, which keeps every downstream page (QC, correction, profile, 3-D) line-aware.
4.4.2. Adding Lines To An Existing Survey#
Use +Lines on the command bar (or the Add lines tab of the loader) to merge more data into the survey you already have.
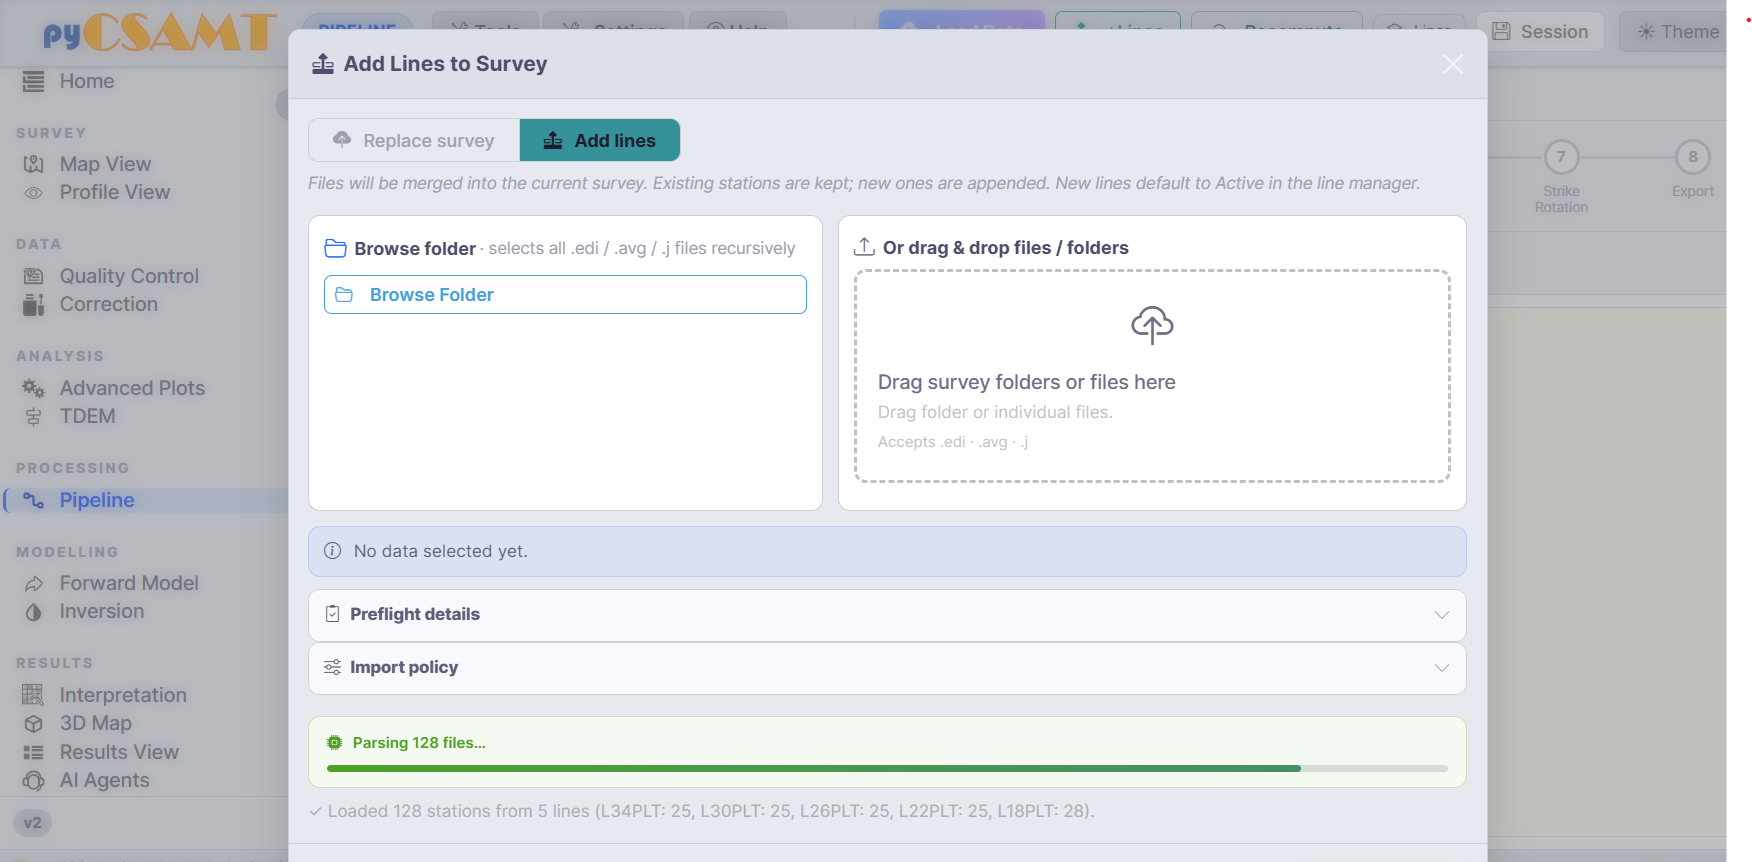
Add lines mode. Existing stations are kept and new ones are appended; newly added lines default to Active in the line manager.#
In Add lines mode, existing stations are preserved and new stations are appended. Any new lines default to Active so they immediately participate in QC, correction, and profile views. Use this to bring later field days or extra profiles into a survey you have already started reviewing.
4.4.3. Managing Survey Lines#
Open the Lines drawer from the command bar to control which lines are active and how they are named.
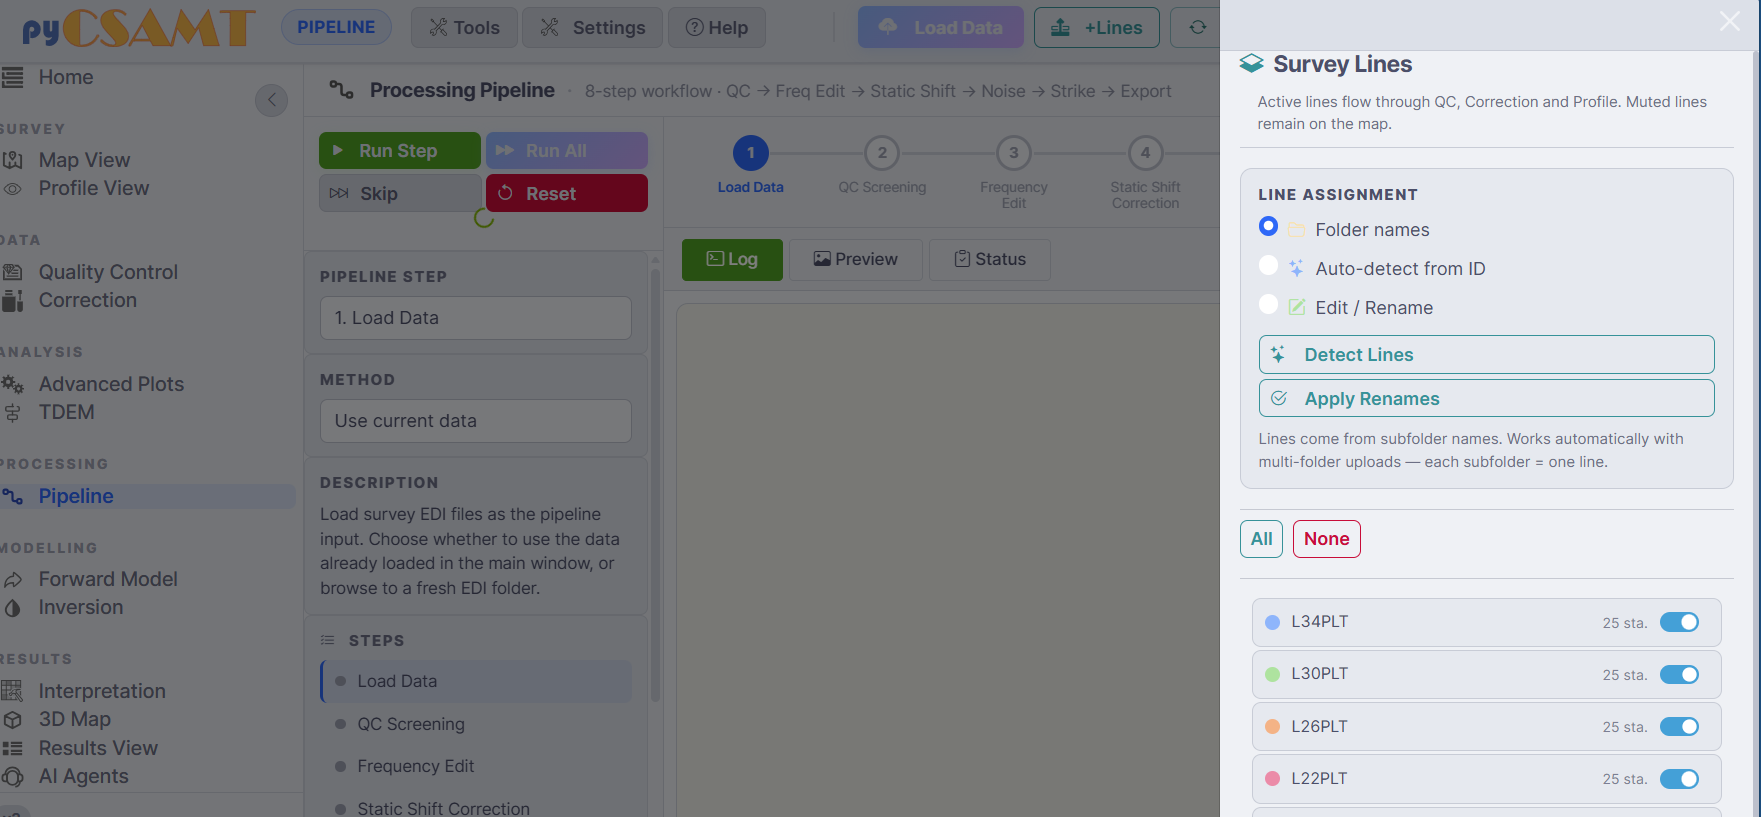
The Survey Lines drawer. Active lines flow through QC, Correction, and Profile; muted lines stay on the map but are excluded from processing.#
Line assignment decides how stations are grouped into lines:
Folder names – one line per subfolder (the default; works automatically with multi-folder uploads).
Auto-detect from ID – infer lines from station identifiers with Detect Lines.
Edit / Rename – rename lines by hand, then Apply Renames.
Below the assignment controls, each line has an Active toggle and a station count. All and None activate or mute every line at once. The key rule:
Active lines flow through QC, Correction, and Profile. Muted lines remain visible on the map but are excluded from processing.
Use this to focus a QC or correction pass on a subset of lines without unloading the rest of the survey. The line selection is shared by every page, and many pages also expose their own per-page line and station pickers for finer control.
4.4.4. Recomputing Transfer Functions#
Use Recompute on the command bar when you want to regenerate apparent resistivity and phase from impedance — for example after rotating components or when you want to work in a restricted frequency band.
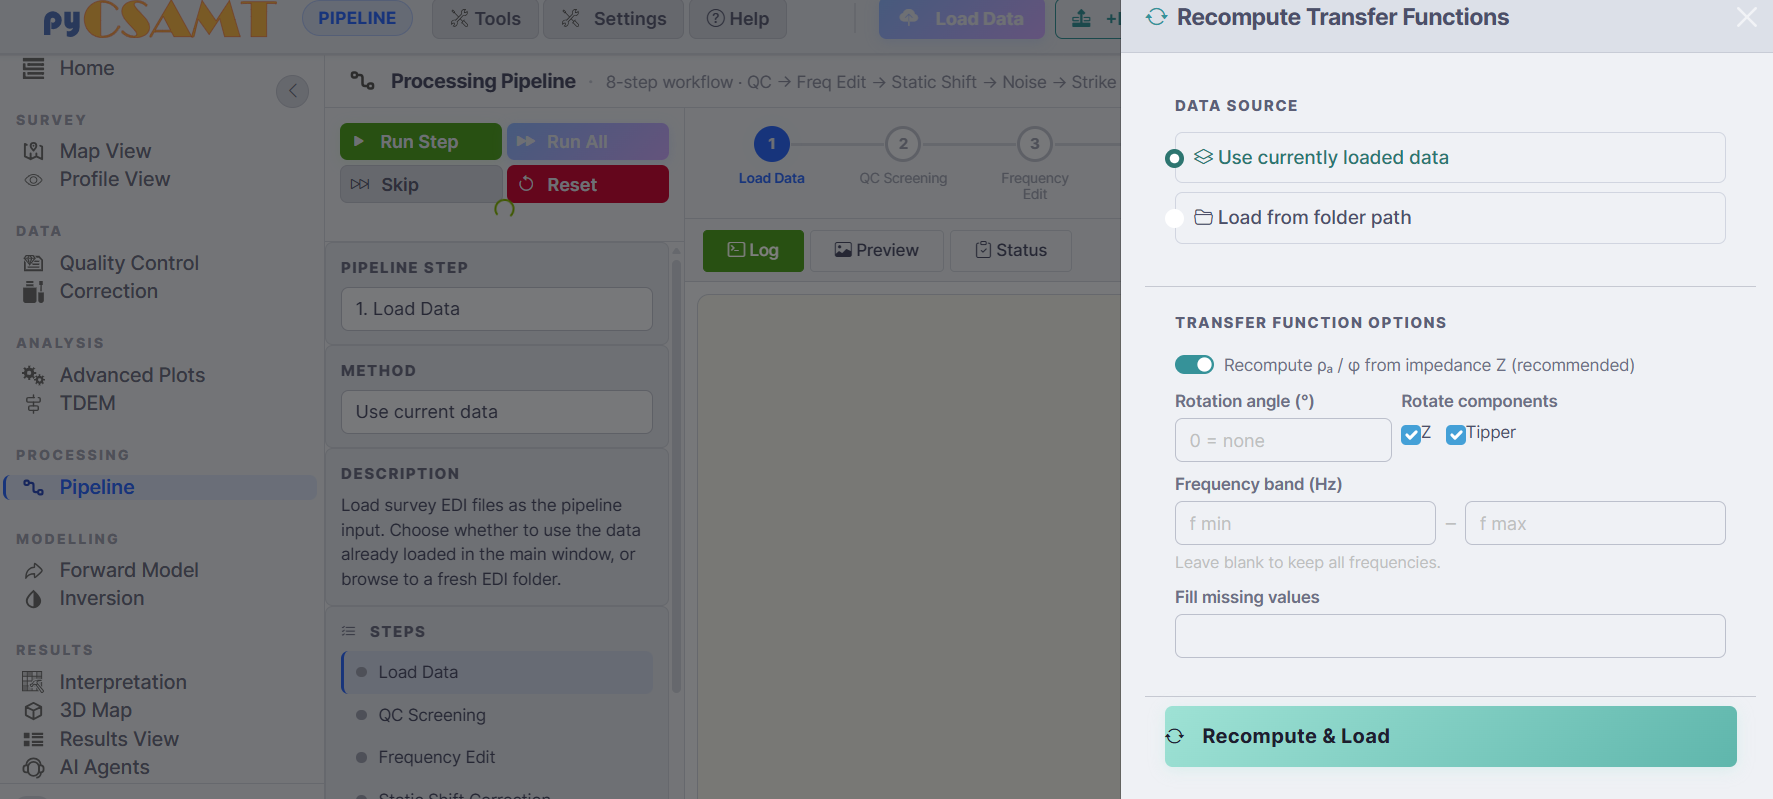
The Recompute drawer. Choose a data source, then recompute ρₐ/φ from the impedance tensor, optionally rotating and restricting the frequency band.#
Recompute treats the impedance tensor \(\mathbf{Z}\) you already loaded as the single source of truth and re-derives everything else from it, rather than adjusting apparent resistivity and phase directly. That ordering matters physically: rotating the tensor and then reducing it to scalars gives the correct rotated ρₐ and φ, whereas rotating already-reduced ρₐ/φ values directly would not. For one component \(Z\) the app applies
with \(Z\) in field units (mV/km per nT) and \(f\) in Hz. When a rotation angle \(\theta\) is set, it is applied to the tensor first, \(\mathbf{Z}'(\theta) = \mathbf{R}(\theta)\,\mathbf{Z}\,\mathbf{R}(\theta)^{\mathsf T}\) with \(\mathbf{R}(\theta)\) the usual 2-D rotation matrix, and the tipper is rotated by the same angle as a vector; \(\rho_a\) and \(\phi\) recomputed afterwards already reflect the new orientation. The drawer exposes each stage of that pipeline as a control:
Data source – use the currently loaded data, or load fresh data from a folder path.
Recompute ρₐ / φ from impedance Z (recommended) – rebuild the apparent resistivity and phase from the impedance tensor using the relations above.
Rotation angle and Rotate components – optionally rotate
Zand the tipper by a fixed angle before ρₐ/φ are derived.Frequency band – restrict to a
f min–f maxwindow; leave blank to keep all frequencies.Fill missing values – optionally fill gaps.
Click Recompute & Load to apply. The result becomes the new active survey.
Note
Recompute rebuilds derived quantities from the impedance tensor; it does not itself apply a physical correction such as static shift, which changes the observed impedance itself rather than how Recompute reduces it to ρₐ/φ. For evidence-based corrections, use the Correction page with its non-destructive chain.
4.4.5. Browser Sessions#
The web app keeps a browser session so your work survives page reloads and can be shared across machines. Open it with Session on the command bar.
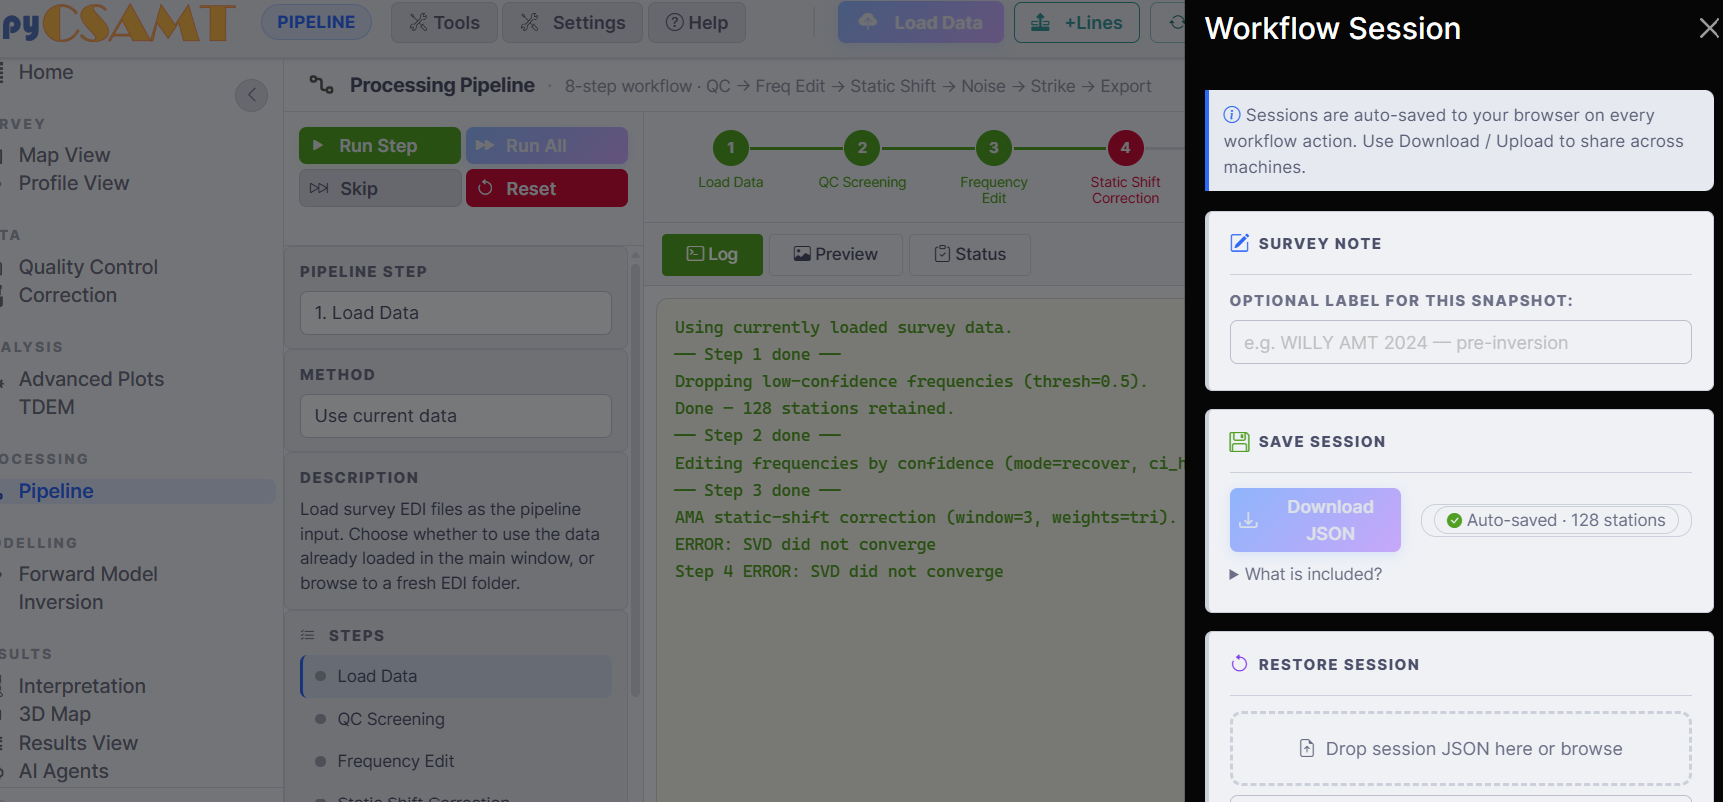
The Workflow Session drawer. Sessions auto-save to the browser on every workflow action; use Download JSON and restore to move a session between machines.#
Sessions are auto-saved to the browser on every workflow action, so a reload does not lose your place.
Survey Note lets you attach an optional label to a snapshot (for example
WILLY AMT 2024 — pre-inversion).Save Session → Download JSON writes the session to a file you can archive or send to a colleague. The What is included? link lists exactly what the file captures.
Restore Session loads a previously downloaded session JSON — drop it on the drop zone or browse to it.
Because the browser is the store, sessions are per-browser and per-machine. The Download / Restore cycle is the supported way to move a session to another computer or another browser.
Note
The session JSON records workflow state and settings, not the raw EDI files themselves. Keep the original survey folder alongside the session file so the survey can be reloaded when you restore.
4.4.6. Data Health After Loading#
After loading or adding lines, take a moment on the Home dashboard (see Navigation And Layout) to confirm:
the expected number of stations, frequencies, and lines;
that stations carry coordinates (the dashboard reports how many do);
that the lines you expect are present and named sensibly.
If any of these look wrong, revisit the Lines drawer (line assignment) or reload with a corrected folder selection before moving into QC, correction, or modelling.
4.4.7. Next Steps#
Maps And Profiles – inspect the loaded survey spatially and per-station.
Processing Pages – QC, corrections, modelling, and the pipeline.
Exports And Reproducibility – save figures, corrected EDIs, and session files.