
3. Desktop GUI#
The pyCSAMT desktop GUI is the local application for interactive CSAMT, AMT, and MT survey work. It is designed for the day-to-day workflow of loading EDI data, checking station geometry, inspecting profiles and maps, running QC, testing corrections, preparing forward and inversion models, exporting figures and processed EDIs, and documenting the processing chain.
The desktop app uses the same scientific package as the Python API. The GUI
is not a separate science layer; it is an interactive surface over pyCSAMT
loaders, Sites objects, processing functions, plotting tools, inversion
builders, and export helpers.
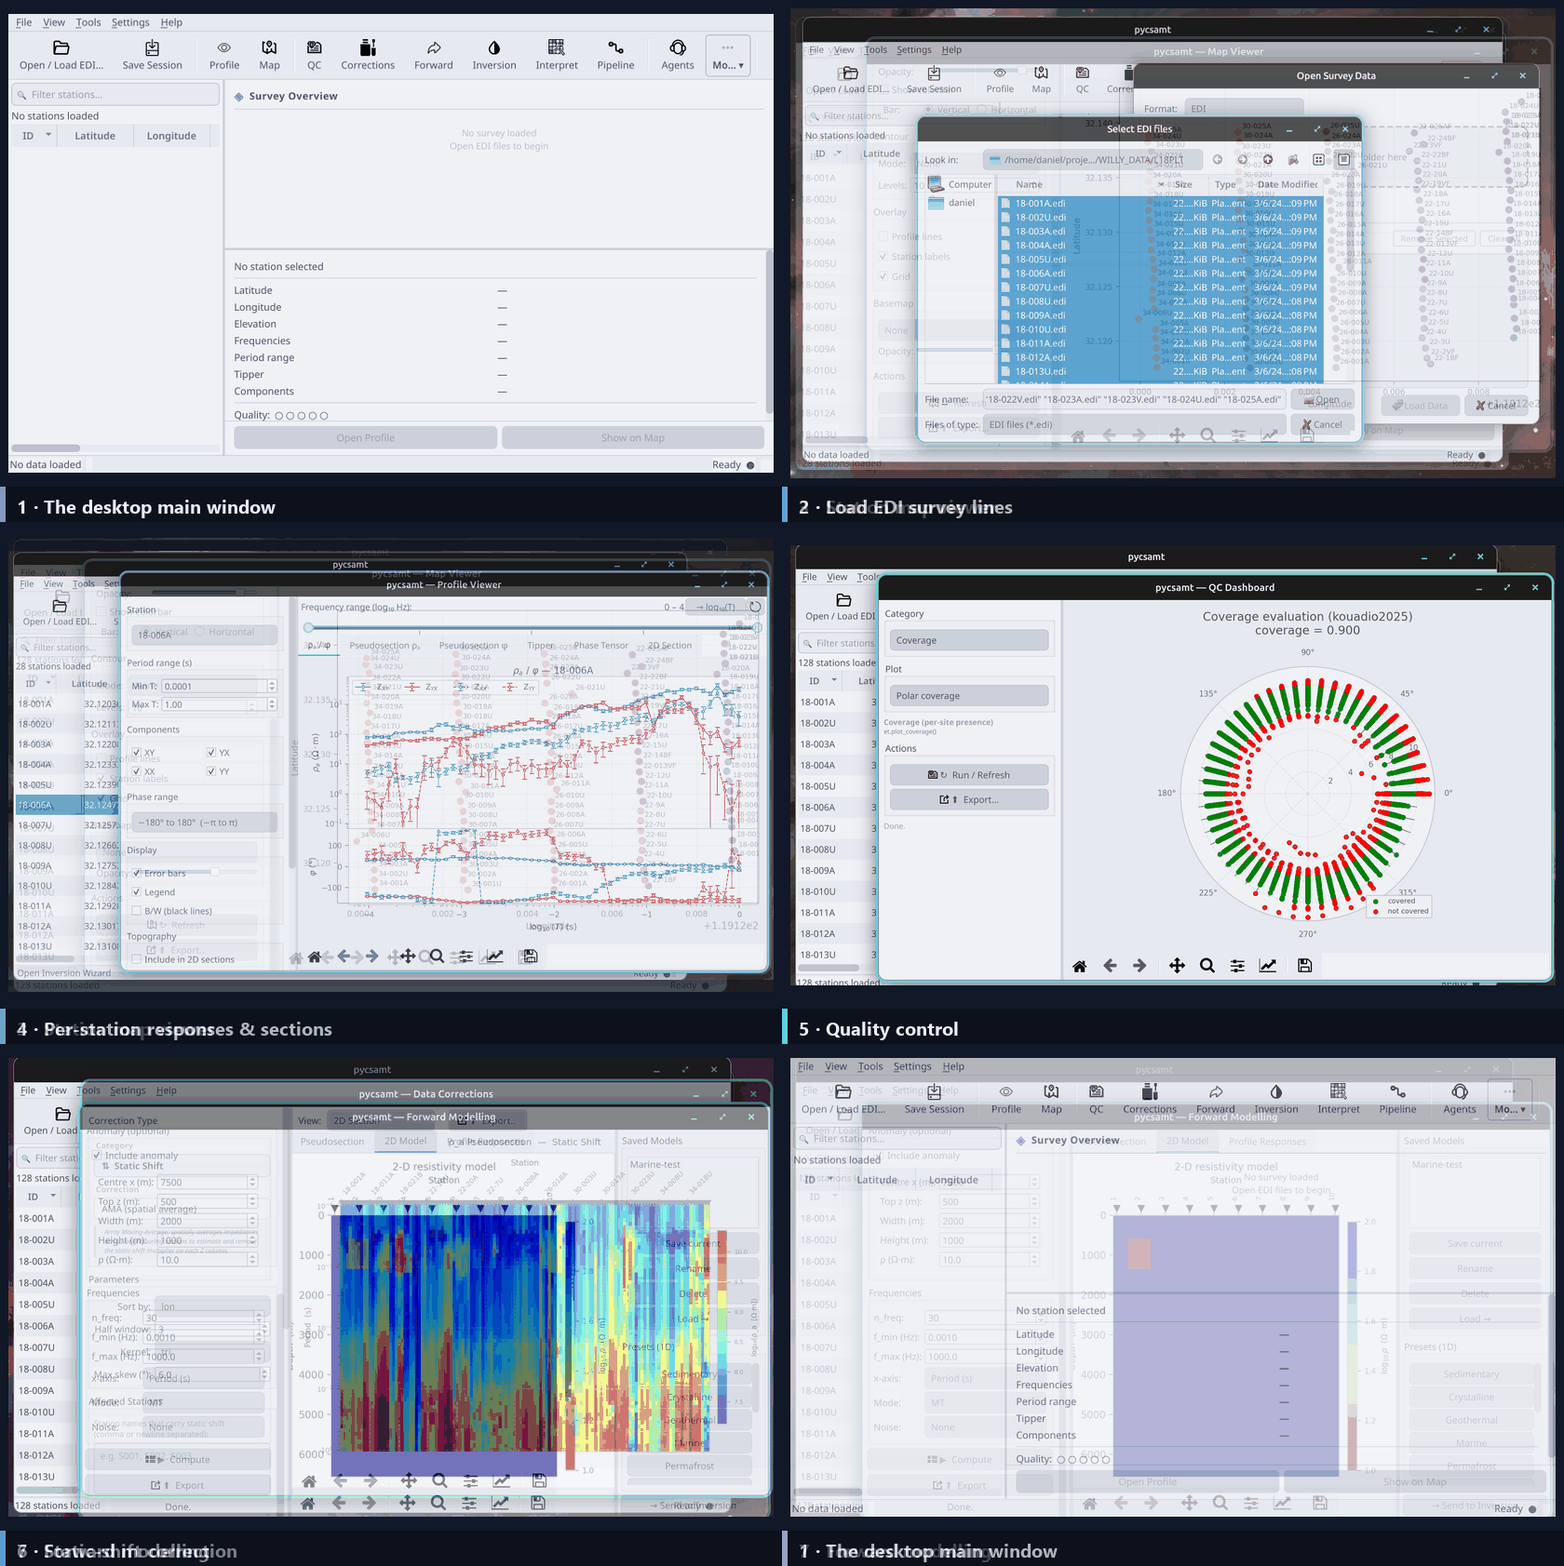
An animated tour of the desktop app: launch the main window, load EDI survey lines, inspect the station map and per-station responses, run quality control, correct static shift, and build a forward model. Each step is documented on the pages below.#
A good first pass, in order, is Overview → Installation → Loading & Sessions → Workspace → Maps & Profiles → Processing Workflows → Exports → Troubleshooting.
- 3.1. Overview
- 3.2. Installation And Launch
- 3.2.1. Why Installation Matters
- 3.2.2. Choose An Installation Path
- 3.2.3. Download A Ready-Made Installer
- 3.2.4. Licensing
- 3.2.5. Install The Desktop Extra
- 3.2.6. Launch The Application
- 3.2.7. Load A First EDI Survey
- 3.2.8. What Success Looks Like
- 3.2.9. First-Launch Checklist
- 3.2.10. Recommended Environment
- 3.2.11. Platform Notes
- 3.2.12. Common Installation Problems
- 3.2.13. Quick Verification
- 3.3. Loading Data And Sessions
- 3.3.1. Why Loading Is A Scientific Step
- 3.3.2. Open Survey Data
- 3.3.3. Choose Files Or Folders
- 3.3.4. Common Selection Mistakes
- 3.3.5. Choosing The Right Loading Scope
- 3.3.6. What Happens During Loading
- 3.3.7. How To Read The First Loaded State
- 3.3.8. Station Search And Selection
- 3.3.9. Recent Files
- 3.3.10. Save And Restore The Desktop Session
- 3.3.11. What The Session Does Not Save
- 3.3.12. Loading Recomputed EDIs
- 3.3.13. When To Reload Instead Of Continue
- 3.3.14. Practical Loading Checklist
- 3.4. Workspace And Navigation
- 3.4.1. Why The Workspace Is Split Into Panels
- 3.4.2. Main Window Regions
- 3.4.3. Orientation After Loading
- 3.4.4. Station List
- 3.4.5. Survey Overview
- 3.4.6. Station Detail Card
- 3.4.7. Panel Windows
- 3.4.8. Secondary And Advanced Tools
- 3.4.9. Suggested Panel Combinations
- 3.4.10. Toolbar And Menus
- 3.4.11. Read Toolbar Actions As Workflow Stages
- 3.4.12. Log Dock And Status Bar
- 3.4.13. Status And Log Interpretation
- 3.4.14. Recent Files
- 3.4.15. Theme And Preferences
- 3.4.16. Preferences That Affect Scientific Work
- 3.4.17. Saved Session State
- 3.4.18. Workspace Habits
- 3.5. Maps And Profiles
- 3.5.1. What These Viewers Help You Decide
- 3.5.2. Recommended Inspection Order
- 3.5.3. Open The Viewers
- 3.5.4. Viewer State And Active Survey
- 3.5.5. Map Viewer Overview
- 3.5.6. Map Review Checklist
- 3.5.7. Map Type Details
- 3.5.8. Reading Map Evidence
- 3.5.9. Coordinate System
- 3.5.10. Frequency, Period, And Component
- 3.5.11. Choosing A Component For Inspection
- 3.5.12. Contours And Spatial Overlays
- 3.5.13. Contour Interpretation Rules
- 3.5.14. Selecting Stations From Maps
- 3.5.15. Map-To-Profile Investigation Loop
- 3.5.16. Profile Viewer Overview
- 3.5.17. Profile Review Checklist
- 3.5.18. Response Controls
- 3.5.19. Reading Response Curves
- 3.5.20. Profile Tabs
- 3.5.21. Which Profile Tab To Use First
- 3.5.22. Per-Tab Guidance
- 3.5.23. Publication View
- 3.5.24. Map And Profile Checks Before Processing
- 3.5.25. Hand-Off To Other Desktop Workflows
- 3.5.26. Export Figures
- 3.5.27. Common Issues
- 3.6. Processing Workflows
- 3.6.1. Recommended Order
- 3.6.2. Active Data Flow
- 3.6.3. Processing Stage Gates
- 3.6.4. Quality Control
- 3.6.5. When QC Is Enough
- 3.6.6. Data Corrections
- 3.6.7. Correction Decision Rules
- 3.6.8. Advanced Diagnostics
- 3.6.9. When Advanced Diagnostics Are Required
- 3.6.10. Forward Modelling
- 3.6.11. Forward Model Readiness
- 3.6.12. Inversion Preparation
- 3.6.13. Ready For Inversion Checklist
- 3.6.14. Processing Pipeline
- 3.6.15. When To Use The Pipeline
- 3.6.16. Agent-Assisted Review
- 3.6.17. Outputs And Reproducibility
- 3.7. Exports And Reproducibility
- 3.7.1. Think In Data States
- 3.7.2. Export Types
- 3.7.3. Figure Export
- 3.7.4. Figure Naming Pattern
- 3.7.5. Batch Plot Export
- 3.7.6. Minimum Evidence Set
- 3.7.7. Survey Metadata Export
- 3.7.8. Metadata Review Uses
- 3.7.9. EDI Data Products
- 3.7.10. EDI Product Safety Rules
- 3.7.11. Recomputed EDIs
- 3.7.12. Recompute Audit Checklist
- 3.7.13. Pipeline Configurations
- 3.7.14. Pipeline Export Package
- 3.7.15. Inversion Exports
- 3.7.16. Inversion Run Naming
- 3.7.17. Interpretation Exports
- 3.7.18. Session And Settings
- 3.7.19. What Not To Rely On
- 3.7.20. Recommended Project Layout
- 3.7.21. Export Checklist
- 3.8. Troubleshooting
- 3.8.1. Troubleshooting Strategy
- 3.8.2. Quick Checks
- 3.8.3. Fast Recovery Path
- 3.8.4. Missing PySide6
- 3.8.5. Command Not Found
- 3.8.6. Wrong Python Environment
- 3.8.7. Desktop Opens But No Data Load
- 3.8.8. Load Failed
- 3.8.9. Raw, Corrected, Or Recomputed State Is Confusing
- 3.8.10. No Data Dialog
- 3.8.11. Station Count Is Wrong
- 3.8.12. Blank Or Empty Plots
- 3.8.13. Figure Export Says No Figure
- 3.8.14. Batch Export Saves Fewer Figures Than Expected
- 3.8.15. Coordinate Or Map Problems
- 3.8.16. Static Shift Correction Looks Too Smooth
- 3.8.17. Correction Was Committed By Mistake
- 3.8.18. Pipeline Stops Or Exports Nothing
- 3.8.19. Pipeline Output Does Not Match Manual Processing
- 3.8.20. Inversion Workdir Or Binary Errors
- 3.8.21. Occam2D Or Solver Result Will Not Plot
- 3.8.22. Inversion Runs But Result Is Not Trustworthy
- 3.8.23. AI Or Agent Runs Fail
- 3.8.24. Session Or Layout Problems
- 3.8.25. Export Folder Is Confusing Or Incomplete
- 3.8.26. Windows PowerShell Profile Warning
- 3.8.27. When To Rebuild Or Reinstall
- 3.8.28. What To Include In A Bug Report