
4.1. Overview#
4.1.1. When To Use The Web App#
The pyCSAMT web application is the browser surface for the same scientific core used by the Python API and the desktop GUI. It is most useful when the work needs to stay interactive but should not depend on every reviewer having a local Python session open. Use it when you need to:
run the full CSAMT/AMT/MT workflow from a browser, without a local Python environment on every workstation;
share a running instance on an internal server so several people can review the same survey;
demonstrate loading, quality control, correction, modelling, and interpretation to a team or class;
combine interactive Plotly maps and sections with Matplotlib figure outputs on one screen;
drive the pyCSAMT agents, including LLM provider-backed assistants, processing agents, and inversion agents, from a chat or a runnable agent list.
The web app is not a second implementation of the geophysics. Its Dash callbacks call the same controllers and pyCSAMT objects used by the desktop application, so the numerical meaning of a station, a response curve, a correction, or an export is unchanged. What changes is the working surface: the browser keeps the active survey in one shared application state while each page reads from that state and writes explicit derived products.
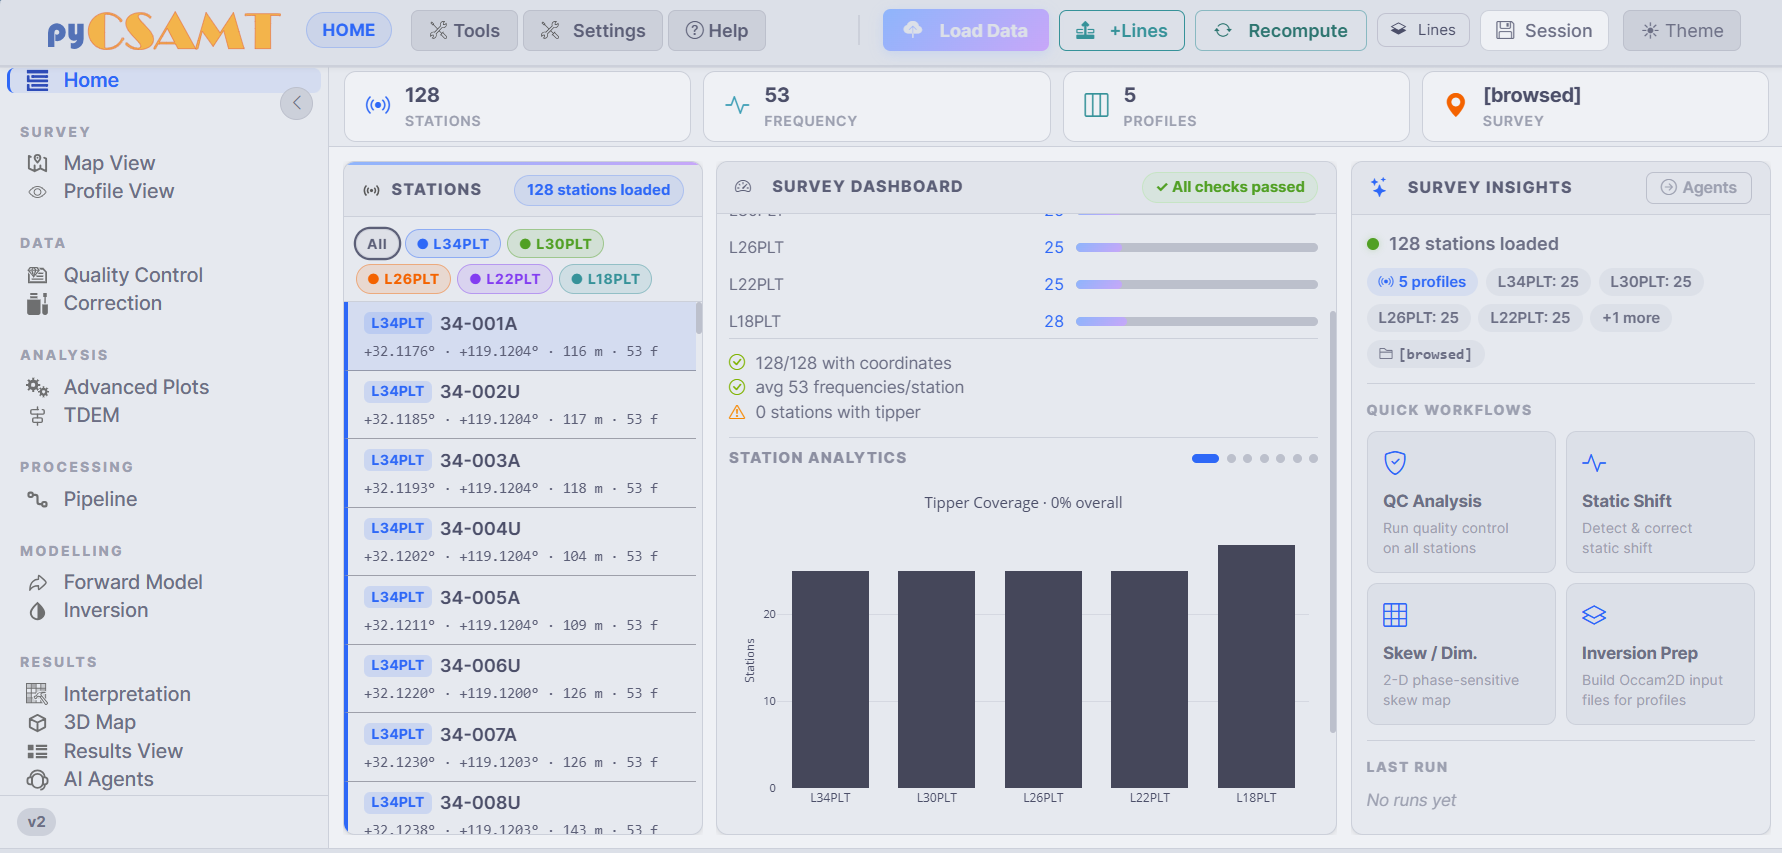
A loaded survey on the Home dashboard. The command bar controls survey-wide actions, the navigation rail moves between workflow pages, and the body summarises station coverage before deeper QC, correction, modelling, or interpretation.#
For scripted or batch work, use the Python API, where every option can be kept in source-controlled code or configuration. For local, single-user interactive review with native windows, use the desktop GUI. For a dedicated conversational surface, use Agent Master.
4.1.2. Run The Web App#
pycsamt-web
The launcher starts a local Dash server and opens the app in your
default browser. It prefers http://127.0.0.1:8050 and automatically
chooses another free port if that one is busy. Keeping the printed URL with the
terminal log is enough to reproduce how the session was launched: it records
the host, the port actually selected, and whether the server was started in
development mode.
From a source checkout, the module entry point launches the same app:
python -m pycsamt.app.web
Common launch options:
pycsamt-web --no-browser        # start the server without opening a browser
pycsamt-web --port 8060         # prefer a specific port
pycsamt-web --port 0            # always ask the OS for a free port
pycsamt-web --host 0.0.0.0      # allow access from other machines on the LAN
pycsamt-web --debug             # enable Dash dev tools and callback debugging
See Installation And Launch for the full option list and Deployment Notes for
host, port, and network guidance. Use --host 127.0.0.1 for a private local
review, --host 0.0.0.0 only when the machine is intentionally serving other
users on a trusted network, and --debug only while developing callbacks
because Dash debug mode exposes development diagnostics.
4.1.4. Main Concepts#
The web app works as one survey state with several views over it. If \(\mathcal{S}\) is the loaded station set and \(L_{active}\) is the selected line set, most pages operate on the masked survey \(\mathcal{S}_{active}\). That is why changing line activation once can immediately affect the map, profile, QC, correction, and export pages. The same idea applies to corrections: each accepted operation is appended to the correction chain, and the app previews derived responses while preserving the original survey as the reproducible input.
Concept |
Meaning In The Web App |
|---|---|
The loaded survey shared by every page: station list, maps, QC, corrections, modelling, and agents all read the same data. |
|
Named subgroups of stations, usually one folder per line. Lines can be toggled Active so a page acts only on the lines you select. |
|
The persistent top bar: page indicator, Tools, Settings, Help, and the survey actions Load Data, +Lines, Recompute, Lines, Session, and Theme. |
|
The collapsible left sidebar that routes between pages; it can be collapsed to icons to widen the plotting area. |
|
A non-destructive stack of correction steps, previewed before Apply, with per-step Undo and full Reset All. |
|
Auto-saved state kept in the browser, such as theme, API key, and last view, plus a downloadable session JSON for sharing across machines. |
|
A figure, corrected EDI, inversion product, or session file meant to be reused outside the current browser state. |
Read the exported files with that state model in mind. A map image is not only a picture; it is a rendering of a selected survey state. A corrected EDI folder is not raw data; it is the result of applying a documented correction chain to an active set of stations. This is why the application keeps line selection, session JSON, figure exports, and result folders close to the same workflow: together they make the interactive review auditable after the browser tab is gone.
4.1.5. Screenshots#
Screenshots are embedded inside the pages where they explain a real action or decision, not collected in a separate gallery. Launch and welcome screens are in Installation And Launch; the command bar, rail, and drawers are in Navigation And Layout; loading and line management are in Loading Data And Sessions; maps and profiles are in Maps And Profiles; and the processing, modelling, results, and agent surfaces are in Processing Pages.