
6.3. Loading Data And Sessions#
MapView reads the same inputs as the rest of pyCSAMT — folders of EDI station files — plus backend-neutral PCSF inversion results that it can place in the same scene as the stations that produced them. Everything is loaded through one dialog with two tabs.
Open the loader from the welcome screen’s Load Survey Lines - Start button or the Load lines button on the top bar. The dialog opens on the Inversion results tab by default; switch to EDI stations for station files.
6.3.1. Inversion Results#
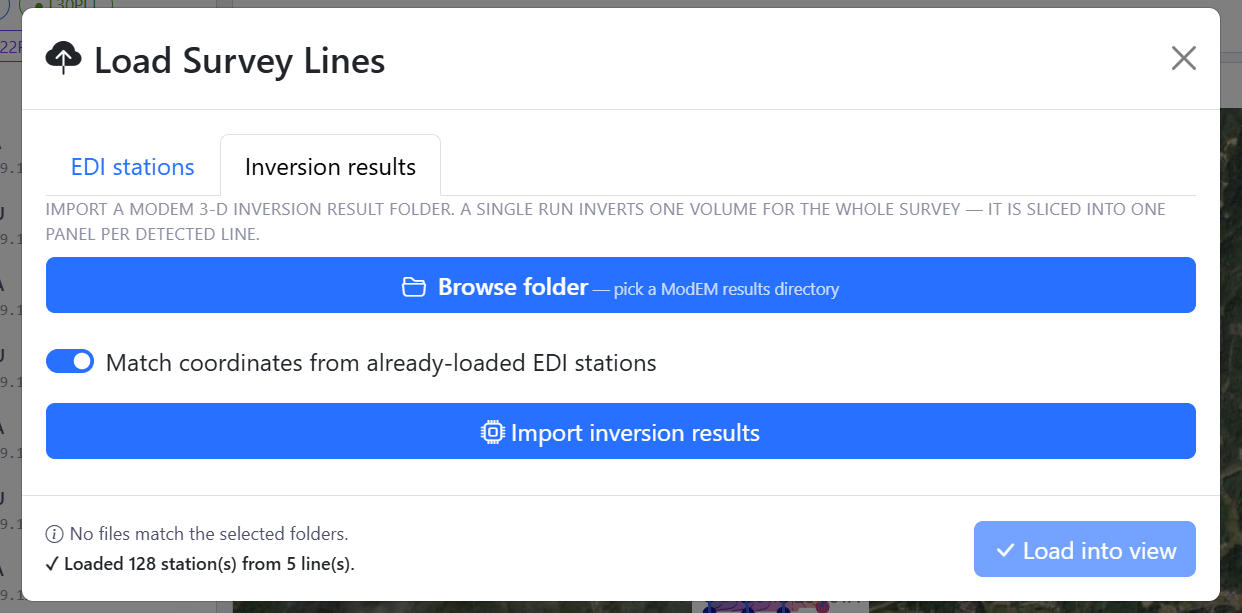
The Inversion results tab imports a backend-neutral PCSF/PCSM result; candidates found are labelled by geometry kind, and only the ones this view can build a curtain from are selectable.#
The Inversion results tab imports model output — a .pcsf, .pcsm,
or gzip-compressed .pcsm.gz file (pyCSAMT’s backend-neutral PCSF format,
see PCSF — Common Subsurface Format) — so you can inspect resistivity
structure in the same scene as the survey geometry:
Browse folder to scan a directory for
.pcsf/.pcsm/.pcsm.gzfiles, or drop/browse the file(s) directly onto the box below it — either way, every match found is listed, each labelled with its geometry kind;every real PCSF geometry kind is selectable and auto-picked when there is exactly one candidate:
grid2d(Occam2D),multiline(a stitched fence of profiles), nativegrid3d(ModEM 3-D, nearest-cell sampled the same way a live ModEM folder is), andmesh_unstructured(MARE2DEM, sampled by point-location on its real triangulation) — only a candidate that could not even be read (a corrupt file, or an unrecognised future geometry kind) is listed disabled;a file’s own real coordinates place it on the basemap directly — no separate EDI match is required when the PCSF file already carries
stations/lon/lat(fromoccam2d_to_pcsf(station_lonlat=...),modem3d_to_pcsf’s ownGG_Lat/GG_Lonpassthrough, orbuild_multiline_pcsf’ssta_lat/sta_lon);leave Match coordinates from already-loaded EDI stations enabled so a matched station’s coordinates/elevation take priority over the file’s own when both are available — load the survey’s EDIs first, then the results;
click Import inversion results.
A raw ModEM/Occam2D/MARE2DEM result folder is not read directly here — convert
it to PCSF/PCSM first (pycsamt.format.adapters, or an inversion result’s
own to_pcsf()-style export). A single ModEM 3-D run inverts one volume for
the whole survey; MapView slices it into one panel per detected line, which
is what you then see in the 3-D fence, block, depth-slice, and iso-surface
renderings (see Views And Controls).
6.3.2. EDI Stations#
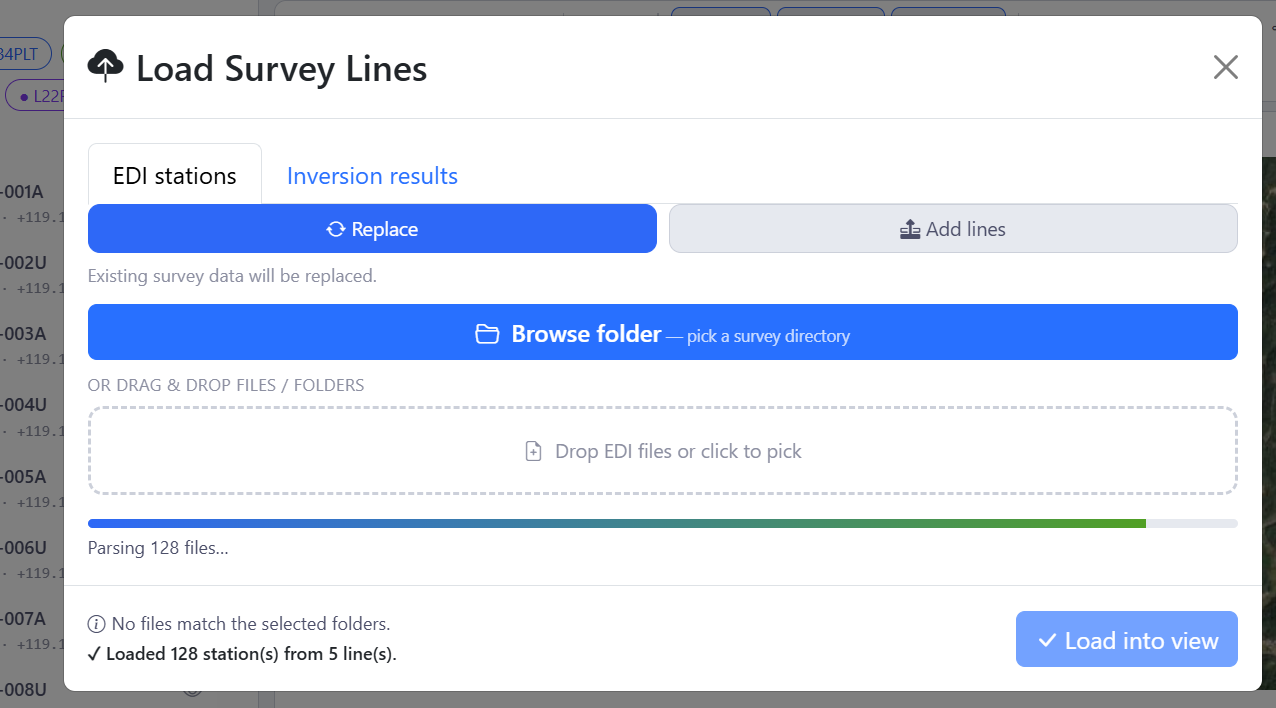
The EDI stations tab: replace or add lines, browse to a survey folder or drag files in, then Load into view.#
On the EDI stations tab:
choose Replace to load a fresh survey, or Add lines to merge more lines into the survey already loaded (existing stations are kept);
use Browse folder to pick a survey directory, or drag EDI/AVG/J files (or whole folders) onto the drop zone;
multi-line surveys load in one pass — each subfolder (or filename prefix) becomes a survey line;
a progress bar reports parsing, and the footer confirms the result (for example Loaded 128 station(s) from 5 line(s));
click Load into view to place the survey on the map.
The same folder can be preloaded from the command line with
pycsamt-mapview --data <folder> (see Installation And Launch).
Once loaded, the line picker and station list in the left panel control what is drawn. The line chips (All, then one per line) toggle whole lines; each station row has an eye toggle to show or hide it. The selection applies to both views — the 2-D map and the 3-D scene alike.
6.3.3. Sites#
The Sites button on the top bar opens station/sites settings — options that control how stations are interpreted and displayed. Use it when station identifiers, grouping, or geometry need adjusting after loading.
6.3.4. Sessions#
Loaded data lives in a per-browser-tab session cache on the server:
you can reload the page without re-uploading the survey;
two browser tabs do not interfere with each other — a second tab starts empty by design;
the Session button on the top bar saves and restores your working state;
restarting the server clears the cache.
MapView never writes into your data folders, so loading, reloading, and restarting are always safe.
See also
- Loading electromagnetic data
How pyCSAMT reads EDI directories and builds survey containers.