
Note
Go to the end to download the full example code.
Browse the local model catalogue#
The AI-inversion agents draw on a catalogue of pre-trained checkpoints.
ModelZooAgent lets you inspect that catalogue —
architectures, solvers, and depth (number of layers) — as a pure metadata
operation: nothing is downloaded, no network is touched, and the cost is
exactly zero.
This example lists the registered models, prints their metadata, and then charts them so the trade-off between architectures is easy to see.
List the catalogue#
The "list" action returns one metadata row per registered model. Each
row carries a name, an arch (architecture family), the solver it
targets, an n_layers depth, and a short description.
from pycsamt.agents import ModelZooAgent
from pycsamt.api.agents import AGENT_CONFIG

with AGENT_CONFIG.offline():
    result = ModelZooAgent().execute({"action": "list"})

rows = result.get("details") or []
print("status    :", result.status)
print("cost (USD):", result.cost_estimate_usd)
print(f"{len(rows)} models registered:\n")
for row in rows:
    print(
        f"  {row['name']:<32} {row['arch']:<8} "
        f"{row['n_layers']:>2} layers  -> {row['solver']}"
    )
status    : success
cost (USD): 0.0
5 models registered:

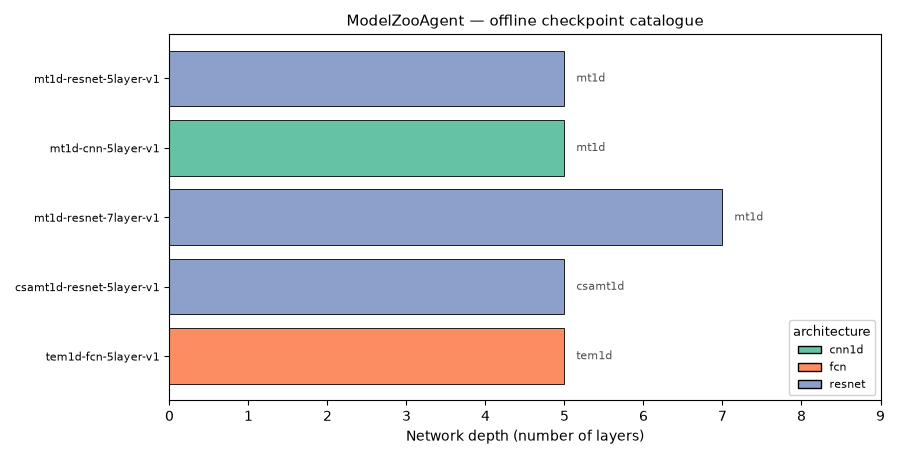
  mt1d-resnet-5layer-v1            resnet    5 layers  -> mt1d
  mt1d-cnn-5layer-v1               cnn1d     5 layers  -> mt1d
  mt1d-resnet-7layer-v1            resnet    7 layers  -> mt1d
  csamt1d-resnet-5layer-v1         resnet    5 layers  -> csamt1d
  tem1d-fcn-5layer-v1              fcn       5 layers  -> tem1d
Chart the catalogue#
A horizontal bar per model — length is the network depth, colour is the architecture family — turns the metadata table into a comparison. The target solver is annotated at the end of each bar, so architecture, depth and intended inversion problem are all readable in one figure.
import matplotlib.pyplot as plt
from matplotlib.patches import Patch

# Stable colour per architecture family.
archs = sorted({row["arch"] for row in rows})
palette = dict(zip(archs, plt.get_cmap("Set2").colors))

names = [row["name"] for row in rows]
depths = [int(row["n_layers"]) for row in rows]
colors = [palette[row["arch"]] for row in rows]

fig, ax = plt.subplots(figsize=(9, 0.6 * len(rows) + 1.6))
bars = ax.barh(names, depths, color=colors, edgecolor="black", linewidth=0.6)
ax.invert_yaxis()
ax.set_xlabel("Network depth (number of layers)")
ax.set_xlim(0, max(depths) + 2)
ax.set_title("ModelZooAgent — offline checkpoint catalogue", fontsize=11)

for bar, row in zip(bars, rows):
    ax.text(
        bar.get_width() + 0.15,
        bar.get_y() + bar.get_height() / 2,
        row["solver"],
        va="center",
        fontsize=8,
        color="0.3",
    )

handles = [
    Patch(facecolor=palette[a], edgecolor="black", label=a) for a in archs
]
ax.legend(
    handles=handles,
    title="architecture",
    fontsize=8,
    title_fontsize=9,
    loc="lower right",
    framealpha=0.9,
)
ax.tick_params(axis="y", labelsize=8)
fig.tight_layout()
Total running time of the script: (0 minutes 0.094 seconds)