
Note
Go to the end to download the full example code.
Monitor inversion convergence#
After a ModEM or Occam-style run folder has been created, the next question is not only “did the executable finish?” The better question is:
is the inversion learning from the data in a stable and geologically useful way?
This example shows a practical monitoring workflow for an inversion run. It uses the run folders created by the previous example and builds a realistic convergence dashboard from two sources:
an Occam2D-style text log parsed with
pycsamt.models.occam2d.OccamLog;a ModEM-style normalized CSV history, useful when the backend text output is noisy or platform-dependent.
The example does not launch any external inversion executable. Instead it creates compact demonstration histories in the run folders, then shows the same checks you would apply to real output files: RMS reduction, roughness growth, step-size collapse, late-iteration stagnation, and best-iteration selection.
1. Imports and workspace paths#
import csv
import json
import os
import sys
from pathlib import Path

# sphinx-gallery executes examples without __file__ (the gallery
# runner sets the working directory to this example's folder).
try:
    EXAMPLE_DIR = Path(__file__).resolve().parent
except NameError:
    EXAMPLE_DIR = Path.cwd()

import matplotlib.pyplot as plt
import numpy as np
import pandas as pd


def repo_root():
    root = os.environ.get("PYCSAMT_DOCS_REPO_ROOT")
    return Path(root) if root else EXAMPLE_DIR.parents[2]


ROOT = repo_root()
if str(ROOT) not in sys.path:
    sys.path.insert(0, str(ROOT))

from pycsamt.models.occam2d import OccamLog

workspace = EXAMPLE_DIR / "workspaces" / "l18_prepared_workspace"
table_dir = workspace / "02_tables"
run_root = workspace / "04_run_files"
figure_dir = workspace / "05_figures"

modem_dir = run_root / "modem_2d"
occam_dir = run_root / "occam2d"

for path in (modem_dir, occam_dir, figure_dir):
    path.mkdir(parents=True, exist_ok=True)
2. Check that the run folders are ready#
A convergence monitor should start from a known run folder. If the previous example has not been run, fail early with a clear instruction instead of producing misleading empty plots.
audit_file = run_root / "run_folder_audit.csv"
if not audit_file.exists():
    raise RuntimeError(
        "Run-folder audit missing. Run plot_5_create_modem_occam_run_folder.py "
        "before this convergence-monitoring example."
    )

audit = pd.read_csv(audit_file)
folder_health = audit.groupby("folder")["exists"].mean().rename("completeness")
print("Run-folder completeness:")
print(folder_health.to_string())

if (folder_health < 1.0).any():
    missing = audit.loc[~audit["exists"], ["folder", "file"]]
    raise RuntimeError(
        "Cannot monitor an incomplete inversion folder. Missing files:\n"
        + missing.to_string(index=False)
    )

policy_file = table_dir / "inversion_data_error_policy.json"
policy = json.loads(policy_file.read_text(encoding="utf-8"))
target_rms = 1.05
Run-folder completeness:
folder
modem_2d    1.0
occam2d     1.0
3. Build demonstration convergence histories#
Real projects would replace this block with solver outputs:
Occam2D: read the actual
LogFile.logfilewithOccamLog.read;ModEM: convert text logs to a table with columns like
iteration,rms,objectiveandmodel_norm.
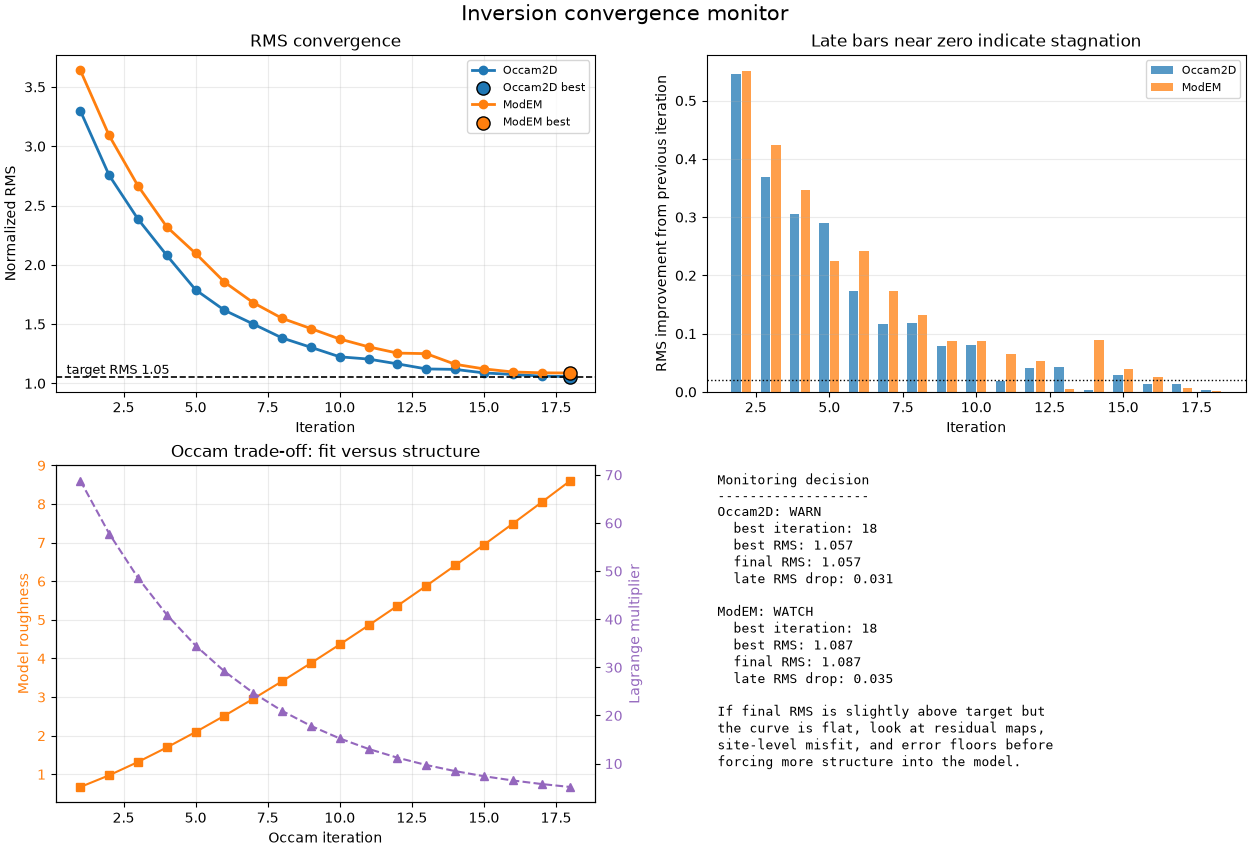
The synthetic histories below are deliberately realistic enough to teach interpretation. The RMS decreases fast at first, then slowly. Roughness and model norm rise as the inversion adds structure. A warning sign appears when RMS improvement becomes tiny while roughness still grows.
rng = np.random.default_rng(42)
iterations = np.arange(1, 19)

occam_rms = 1.02 + 2.95 * np.exp(-0.26 * iterations)
occam_rms += rng.normal(0.0, 0.018, size=iterations.size)
occam_rms = np.maximum.accumulate(occam_rms[::-1])[::-1]
occam_rms[-3:] = [1.075, 1.061, 1.057]

roughness = 0.45 + 0.22 * iterations**1.25
lagrange = 80.0 * np.exp(-0.18 * iterations) + 2.0
stepsize = np.clip(0.95 * np.exp(-0.055 * iterations), 0.18, None)
stepsize[-3:] = [0.22, 0.19, 0.17]

modem_rms = 1.04 + 3.25 * np.exp(-0.23 * iterations)
modem_rms += rng.normal(0.0, 0.022, size=iterations.size)
modem_rms = np.maximum.accumulate(modem_rms[::-1])[::-1]
modem_rms[-4:] = [1.122, 1.096, 1.089, 1.087]
objective = (modem_rms**2) * 1200.0 + 38.0 * np.log1p(iterations)
model_norm = 0.75 + 0.32 * iterations**1.18


def write_occam_demo_log(path, iters, rms, rough, mu, step):
    lines = [
        "pyCSAMT demonstration Occam2D convergence log",
        "This file mimics the important iteration markers parsed by OccamLog.",
        "",
    ]
    previous = float(rms[0] + 0.55)
    for idx, iteration in enumerate(iters):
        lines.extend(
            [
                f"STARTING R.M.S. = {previous:.6f}",
                f"** ITERATION {int(iteration)} **",
                f"TOFMU: MISFIT = {float(rms[idx] + 0.08):.6f}  "
                f"AMU = {float(mu[idx] * 1.2):.6f}",
                f"MINIMUM TOL FROM fminocc IS AT MU = {float(mu[idx]):.6f}",
                f"AND IS = {float(rms[idx]):.6f}",
                "USING 4 EVALUATIONS OF FUNCTION",
                f"STEPSIZE IS = {float(step[idx]):.6f}",
                f"ROUGHNESS IS = {float(rough[idx]):.6f}",
                "",
            ]
        )
        previous = float(rms[idx])
    path.write_text("\n".join(lines), encoding="utf-8")


occam_log_file = occam_dir / "LogFile.logfile"
write_occam_demo_log(
    occam_log_file,
    iterations,
    occam_rms,
    roughness,
    lagrange,
    stepsize,
)

modem_history_file = modem_dir / "modem_convergence_history.csv"
with modem_history_file.open("w", newline="", encoding="utf-8") as fh:
    writer = csv.DictWriter(
        fh,
        fieldnames=[
            "iteration",
            "rms",
            "objective",
            "model_norm",
            "gradient_norm",
        ],
    )
    writer.writeheader()
    for iteration, rms, obj, norm in zip(
        iterations,
        modem_rms,
        objective,
        model_norm,
    ):
        writer.writerow(
            {
                "iteration": int(iteration),
                "rms": f"{float(rms):.6f}",
                "objective": f"{float(obj):.6f}",
                "model_norm": f"{float(norm):.6f}",
                "gradient_norm": f"{float(1.4 / iteration):.6f}",
            }
        )
4. Parse logs into common monitoring tables#
OccamLog gives arrays aligned by iteration. We convert them to a table
so that the Occam and ModEM histories can be audited with the same helper
functions.
occam_log = OccamLog.read(occam_log_file)
print(occam_log.summary().replace("→", "->"))

occam_history = pd.DataFrame(
    {
        "backend": "Occam2D",
        "iteration": occam_log.iterations,
        "rms": occam_log.rms,
        "roughness": occam_log.roughness,
        "lagrange": occam_log.lagrange,
        "stepsize": occam_log.stepsize,
    }
)

modem_history = pd.read_csv(modem_history_file)
modem_history.insert(0, "backend", "ModEM")
modem_history["roughness"] = np.nan
modem_history["lagrange"] = np.nan
modem_history["stepsize"] = np.nan

history = pd.concat(
    [
        occam_history[
            [
                "backend",
                "iteration",
                "rms",
                "roughness",
                "lagrange",
                "stepsize",
            ]
        ],
        modem_history[
            [
                "backend",
                "iteration",
                "rms",
                "roughness",
                "lagrange",
                "stepsize",
            ]
        ],
    ],
    ignore_index=True,
)

history["rms_drop"] = history.groupby("backend")["rms"].diff(-1).abs()
history["relative_drop_pct"] = (
    history.groupby("backend")["rms"].pct_change().abs() * 100.0
)
history.loc[history["iteration"] == 1, "relative_drop_pct"] = np.nan
history["within_target"] = history["rms"] <= target_rms

history_file = run_root / "convergence_history_normalized.csv"
history.to_csv(history_file, index=False)

print("Normalized convergence history preview:")
print(history.head(8).to_string(index=False))
OccamLog: 18 iterations | initial RMS 3.3001 -> final RMS 1.0570 | best iter 18 (RMS 1.0570) | converged: False
Normalized convergence history preview:
backend  iteration      rms  roughness  lagrange  stepsize  rms_drop  relative_drop_pct  within_target
Occam2D          1 3.300087   0.670000 68.821617  0.899161  0.544971                NaN          False
Occam2D          2 2.755116   0.973251 57.814106  0.851042  0.369310          16.513837          False
Occam2D          3 2.385806   1.318609 48.619860  0.805499  0.306185          13.404517          False
Occam2D          4 2.079621   1.694508 40.940180  0.762393  0.290771          12.833608          False
Occam2D          5 1.788850   2.094884 34.525573  0.721594  0.172388          13.981923          False
Occam2D          6 1.616462   2.515912 29.167642  0.682978  0.116185           9.636806          False
Occam2D          7 1.500277   2.954928 24.692322  0.646428  0.117425           7.187611          False
Occam2D          8 1.382852   3.409955 20.954221  0.611835  0.078988           7.826888          False
5. Diagnose convergence behavior#
A single final RMS value can hide several problems. These compact checks are intentionally simple so users can adapt them to their own tolerance:
target reached: any iteration is at or below the requested RMS;
best iteration: the lowest finite RMS, not necessarily the last model;
stagnation: the last few iterations improve by less than a small amount;
roughening: roughness keeps growing after the data fit has nearly stopped improving.
def diagnose_backend(frame, target, stagnation_window=4, small_drop=0.02):
    ordered = frame.sort_values("iteration").copy()
    finite = ordered[np.isfinite(ordered["rms"])]
    if finite.empty:
        return {
            "backend": str(ordered["backend"].iloc[0]),
            "status": "FAIL",
            "best_iteration": None,
            "best_rms": np.nan,
            "final_rms": np.nan,
            "target_reached": False,
            "late_rms_drop": np.nan,
            "message": "No finite RMS values were found.",
        }

    best_row = finite.loc[finite["rms"].idxmin()]
    tail = finite.tail(stagnation_window)
    late_drop = float(tail["rms"].iloc[0] - tail["rms"].iloc[-1])
    target_reached = bool((finite["rms"] <= target).any())

    roughening = False
    if (
        "roughness" in finite
        and finite["roughness"].notna().sum() >= stagnation_window
    ):
        rough_tail = finite.dropna(subset=["roughness"]).tail(
            stagnation_window
        )
        if len(rough_tail) >= stagnation_window:
            roughening = bool(
                rough_tail["roughness"].iloc[-1]
                > 1.10 * rough_tail["roughness"].iloc[0]
            )

    if target_reached:
        status = "PASS"
        message = (
            "Target RMS was reached; inspect the best model and response fit."
        )
    elif late_drop < small_drop:
        status = "WARN"
        message = (
            "RMS improvement is small in the last iterations; consider stopping, "
            "relaxing/raising errors, or revisiting the starting model."
        )
    else:
        status = "WATCH"
        message = "RMS is still improving; continue monitoring before selecting a model."

    if roughening and not target_reached:
        status = "WARN"
        message += " Roughness is still growing, so avoid accepting extra structure blindly."

    return {
        "backend": str(best_row["backend"]),
        "status": status,
        "best_iteration": int(best_row["iteration"]),
        "best_rms": float(best_row["rms"]),
        "final_rms": float(finite["rms"].iloc[-1]),
        "target_reached": target_reached,
        "late_rms_drop": late_drop,
        "message": message,
    }


diagnostics = pd.DataFrame(
    [
        diagnose_backend(group, target_rms)
        for _, group in history.groupby("backend", sort=False)
    ]
)
diagnostics_file = run_root / "convergence_diagnostics.csv"
diagnostics.to_csv(diagnostics_file, index=False)

print("Convergence diagnostics:")
print(diagnostics.to_string(index=False))
Convergence diagnostics:
backend status  best_iteration  best_rms  final_rms  target_reached  late_rms_drop                                                                                                                                       message
Occam2D   WARN              18     1.057      1.057           False       0.031129 RMS is still improving; continue monitoring before selecting a model. Roughness is still growing, so avoid accepting extra structure blindly.
  ModEM  WATCH              18     1.087      1.087           False       0.035000                                                                         RMS is still improving; continue monitoring before selecting a model.
6. Plot a convergence dashboard#
The top panel answers “is the data misfit still decreasing?” The lower panels answer “what did we pay for that decrease?” In smooth inversions, a very small RMS decrease accompanied by a large roughness increase is often a sign that the next model is less interpretable, even if the number looks slightly better.
fig, axes = plt.subplots(2, 2, figsize=(12.5, 8.5), constrained_layout=True)
ax_rms, ax_drop, ax_occam, ax_text = axes.ravel()

for backend, frame in history.groupby("backend", sort=False):
    ax_rms.plot(
        frame["iteration"],
        frame["rms"],
        marker="o",
        linewidth=2,
        label=backend,
    )
    best = frame.loc[frame["rms"].idxmin()]
    ax_rms.scatter(
        best["iteration"],
        best["rms"],
        s=90,
        zorder=4,
        edgecolor="black",
        label=f"{backend} best",
    )

ax_rms.axhline(target_rms, color="black", linestyle="--", linewidth=1.2)
ax_rms.text(
    0.02,
    target_rms + 0.03,
    f"target RMS {target_rms:.2f}",
    transform=ax_rms.get_yaxis_transform(),
    fontsize=9,
)
ax_rms.set_xlabel("Iteration")
ax_rms.set_ylabel("Normalized RMS")
ax_rms.set_title("RMS convergence")
ax_rms.grid(True, alpha=0.25)
ax_rms.legend(fontsize=8)

for backend, frame in history.groupby("backend", sort=False):
    ordered = frame.sort_values("iteration")
    improvement = -ordered["rms"].diff()
    ax_drop.bar(
        ordered["iteration"] + (-0.18 if backend == "Occam2D" else 0.18),
        improvement,
        width=0.32,
        alpha=0.75,
        label=backend,
    )
ax_drop.axhline(0.02, color="black", linestyle=":", linewidth=1.0)
ax_drop.set_xlabel("Iteration")
ax_drop.set_ylabel("RMS improvement from previous iteration")
ax_drop.set_title("Late bars near zero indicate stagnation")
ax_drop.grid(True, axis="y", alpha=0.25)
ax_drop.legend(fontsize=8)

occam_plot = occam_history.sort_values("iteration")
ax_occam.plot(
    occam_plot["iteration"],
    occam_plot["roughness"],
    color="tab:orange",
    marker="s",
    label="roughness",
)
ax_occam.set_xlabel("Occam iteration")
ax_occam.set_ylabel("Model roughness", color="tab:orange")
ax_occam.tick_params(axis="y", labelcolor="tab:orange")
ax_occam.grid(True, alpha=0.25)
ax_occam.set_title("Occam trade-off: fit versus structure")

ax_mu = ax_occam.twinx()
ax_mu.plot(
    occam_plot["iteration"],
    occam_plot["lagrange"],
    color="tab:purple",
    marker="^",
    linestyle="--",
    label="Lagrange multiplier",
)
ax_mu.set_ylabel("Lagrange multiplier", color="tab:purple")
ax_mu.tick_params(axis="y", labelcolor="tab:purple")

summary_lines = [
    "Monitoring decision",
    "-------------------",
]
for row in diagnostics.itertuples(index=False):
    summary_lines.extend(
        [
            f"{row.backend}: {row.status}",
            f"  best iteration: {row.best_iteration}",
            f"  best RMS: {row.best_rms:.3f}",
            f"  final RMS: {row.final_rms:.3f}",
            f"  late RMS drop: {row.late_rms_drop:.3f}",
            "",
        ]
    )
summary_lines.extend(
    [
        "If final RMS is slightly above target but",
        "the curve is flat, look at residual maps,",
        "site-level misfit, and error floors before",
        "forcing more structure into the model.",
    ]
)

ax_text.axis("off")
ax_text.text(
    0.02,
    0.98,
    "\n".join(summary_lines),
    va="top",
    family="monospace",
    fontsize=9.5,
)

fig.suptitle("Inversion convergence monitor", fontsize=15)
dashboard_file = figure_dir / "inversion_convergence_monitor.png"
fig.savefig(dashboard_file, dpi=180)
plt.show()
7. Write a small monitoring report#
The report is intentionally machine-readable. In a real project it can be attached to a run archive, compared between solver attempts, or used by CI to flag suspicious run histories.
report = {
    "target_rms": target_rms,
    "error_policy": {
        "rho_error_floor_percent": policy.get("rho_error_floor_percent"),
        "phase_error_floor_deg": policy.get("phase_error_floor_deg"),
        "impedance_relative_floor": policy.get("impedance_relative_floor"),
    },
    "inputs": {
        "occam_log": str(occam_log_file),
        "modem_history": str(modem_history_file),
        "run_folder_audit": str(audit_file),
    },
    "outputs": {
        "normalized_history": str(history_file),
        "diagnostics": str(diagnostics_file),
        "dashboard": str(dashboard_file),
    },
    "diagnostics": diagnostics.to_dict(orient="records"),
}

report_file = run_root / "convergence_monitor_report.json"
report_file.write_text(json.dumps(report, indent=2), encoding="utf-8")

print(f"Normalized history: {history_file}")
print(f"Diagnostics table: {diagnostics_file}")
print(f"Monitoring report: {report_file}")
print(f"Dashboard figure: {dashboard_file}")
Normalized history: /opt/build/repo/docs/examples/inversion/workspaces/l18_prepared_workspace/04_run_files/convergence_history_normalized.csv
Diagnostics table: /opt/build/repo/docs/examples/inversion/workspaces/l18_prepared_workspace/04_run_files/convergence_diagnostics.csv
Monitoring report: /opt/build/repo/docs/examples/inversion/workspaces/l18_prepared_workspace/04_run_files/convergence_monitor_report.json
Dashboard figure: /opt/build/repo/docs/examples/inversion/workspaces/l18_prepared_workspace/05_figures/inversion_convergence_monitor.png
8. How to use this with real solver output#
For a real Occam2D run, replace the demonstration log path with the true solver log:
occam_log = OccamLog.read(occam_dir / "LogFile.logfile")
For ModEM or another backend, normalize its text output to a CSV with at
least iteration and rms columns. Additional columns such as objective
function, model norm, gradient norm, accepted step length, or wall time make
the diagnostic much more useful.
A model is usually ready for interpretation when these conditions agree:
RMS has reached the planned target, or the last iterations are clearly flat;
residuals are spatially balanced rather than concentrated at a few sites;
roughness/model norm has not exploded for tiny RMS gains;
the selected iteration is documented, not just “the last file in the folder”.
The most useful next gallery step is to load the selected response/model and map where misfit remains high.
Total running time of the script: (0 minutes 0.826 seconds)