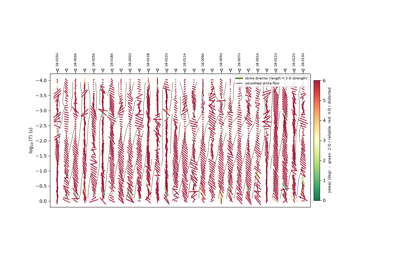
Survey diagnostics#
A guided, end-to-end visual walkthrough of a real electromagnetic
survey using pycsamt.emtools. Where the EM tools section documents each module in isolation, this
gallery takes one bundled dataset from raw impedances to a full
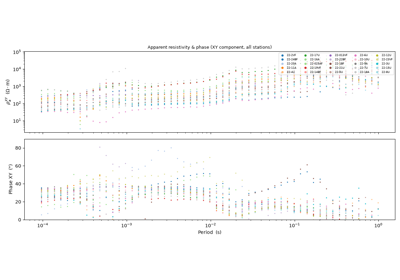
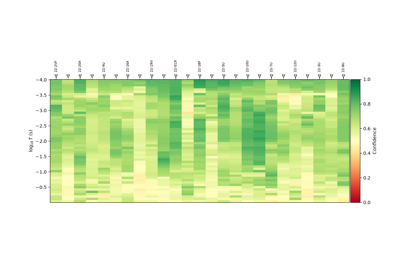
structural interpretation — frequency coverage and data-quality
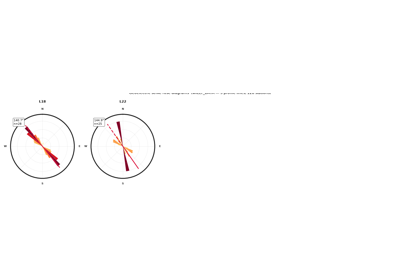
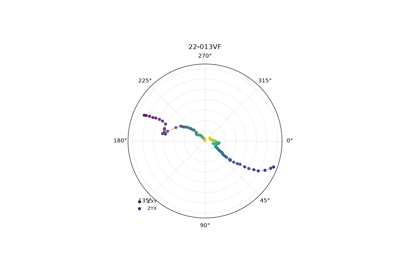
confidence, apparent resistivity and phase, impedance phasor
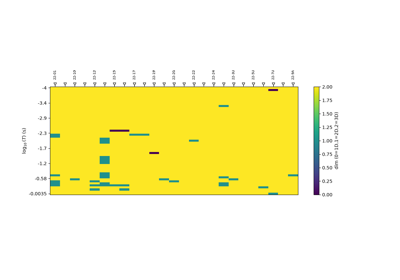
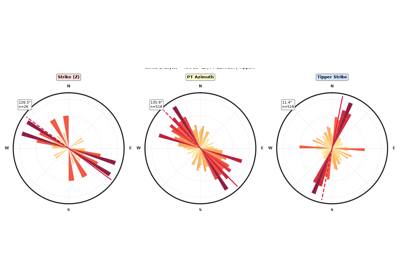
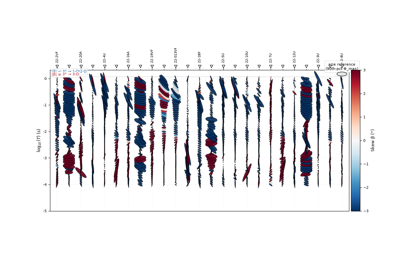
diagnostics, phase-tensor ellipses, dimensionality / skew / anisotropy,
geoelectric strike, and (on a tipper-bearing line) induction arrows.
The primary dataset is the bundled WILLY_DATA AMT survey
(data/AMT/WILLY_DATA/ — 5 profile lines, 128 stations); line
L22PLT (25 stations) carries most of the single-line figures, with
all five lines used together for the multi-profile roses and ellipse
strips. The vertical-field / induction-arrow examples use the SAMTEX
KAP03 long-period MT line (data/MT/kap03lmt_edis/), the only
bundled survey recorded with a real tipper channel.
Every figure below is produced by the same pycsamt.emtools plotting
functions you would call on your own data, and is regenerated on each
documentation build.