
Note
Go to the end to download the full example code.
Phase-tensor analysis and tensor editing (pycsamt.emtools.tensor)#
pycsamt.emtools.tensor is the largest emtools module: the
phase-tensor invariants (Caldwell et al. 2004) computed from the
impedance tensor — principal axes, strike angle θ, skew β, and
ellipticity — a full family of pseudo-section, rose-diagram,
geographic-map, and per-station “ellipse strip” views built on them,
and a set of impedance-tensor editing operations (rotation,
antisymmetrisation, inversion, sensor-orientation correction,
outlier-clipping, off-diagonal balancing). This example uses
L18PLT (data/AMT/WILLY_DATA/) throughout, with KAP03
(data/MT/kap03lmt_edis/) brought in for the geographic map’s
tipper overlay and for a real example of a bug this module’s map
function had.
Five real bugs turned up while building this example and are fixed
along the way: three impedance-rotation functions
(rotate(),
rotate_to_strike(),
rotate_by_map()) were complete silent
no-ops; orient_from_sensors() raised a
TypeError on every call; and
plot_phase_tensor_map() crashed on any
survey whose EDI files carry no per-station LAT/LONG in
>HEAD (KAP03 is exactly such a survey) instead of showing its own
“no geographic coordinates” message.
1. The foundation: phase-tensor invariants#
build_phase_tensor_table() computes,
for every (station, frequency) pair, the phase tensor
\(\Phi = X^{-1}Y\) (X, Y the real/imaginary parts of Z) and its
invariants: principal values s1/s2, strike theta,
Bahr-style angles alpha/beta (beta is the skew, aliased
as skew), and ellipt = (s1-s2)/(s1+s2). Every other function
in this module is built on this one table.
import numpy as np
from _datasets import load_survey

from pycsamt.emtools import (
    antisymmetrize,
    balance_offdiag,
    build_phase_tensor_table,
    ensure_sites,
    invert,
    orient_from_sensors,
    phase_tensor_legend,
    plot_dimensionality_grid,
    plot_dimensionality_psection,
    plot_ellipticity_psection,
    plot_phase_tensor_map,
    plot_phase_tensor_psection,
    plot_phase_tensor_rose,
    plot_phase_tensor_skewmap,
    plot_phase_tensor_strip,
    plot_phase_tensor_strip_grid,
    plot_phase_tensor_summary,
    plot_skew_ellipt_density,
    plot_strike_director_field,
    plot_theta_rose_grid,
    plot_theta_stability_stripe,
    plot_theta_vs_period,
    rotate,
    rotate_by_map,
    sigma_clip_z,
)
from pycsamt.emtools._core import (
    _get_z_block,
    _iter_items,
    _name,
)

# tensor.rotate_to_strike conflicts with strike.rotate_to_strike; the
# top level re-exports strike's under its own name and aliases this
# module's as rotate_z_to_strike -- import the un-aliased name directly
# from .tensor since this example is specifically about this version.
from pycsamt.emtools.tensor import rotate_to_strike

survey = load_survey("amt_l18plt")
S = ensure_sites(
    survey, recursive=False, on_dup="replace", strict=False, verbose=0
)

df = build_phase_tensor_table(S, recursive=False)
print(df.shape, list(df.columns))
print(f"theta range: {df['theta'].min():.1f} to {df['theta'].max():.1f} deg")
print(
    f"skew (beta) range: {df['skew'].min():.1f} to {df['skew'].max():.1f} deg"
)
print(
    f"ellipticity range: {df['ellipt'].min():.3f} to {df['ellipt'].max():.3f}"
)
(1484, 10) ['station', 'freq', 'period', 's1', 's2', 'theta', 'alpha', 'beta', 'skew', 'ellipt']
theta range: -179.4 to 179.6 deg
skew (beta) range: -88.6 to 89.8 deg
ellipticity range: 0.023 to 1.000
Reading this output. 1484 rows = 28 stations x 53 frequencies. Skew already spans nearly the full -90 to +90 degree range across this dataset — a first hint (confirmed properly in section 4) of how far this survey sits from simple 1-D/2-D structure.
2. Simplest view: strike angle vs period, one station at a time#
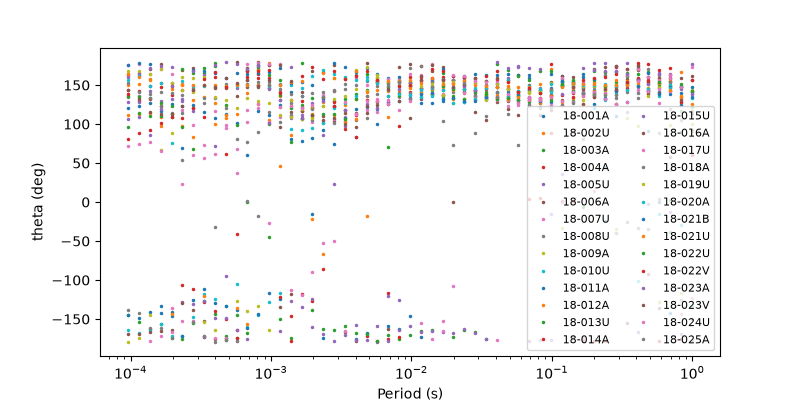
plot_theta_vs_period() scatters raw
theta per frequency for every station on one axes — the most
direct way to see how noisy or stable the phase-tensor strike is.
ax = plot_theta_vs_period(S, recursive=False)
2b. Strike as a director field (axial-aware)#
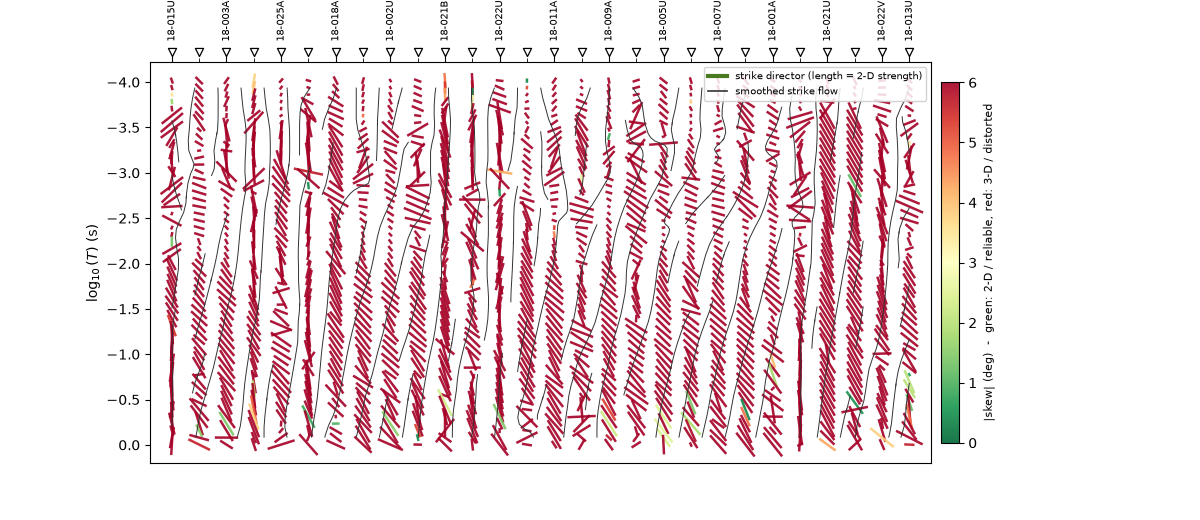
theta is axial (mod 180°), so a linear axis wraps awkwardly and hides
lateral structure. plot_strike_director_field()
draws the strike as a head-less bar at every (station, period) cell —
length encodes 2-D strength (ellipticity), colour encodes distortion
(|skew|), and a streamline overlay traces the coherent strike flow.
See the survey-diagnostics walkthrough for the full
interpretation guide.
ax = plot_strike_director_field(S, recursive=False)
3. Three simple period-vs-station grids#
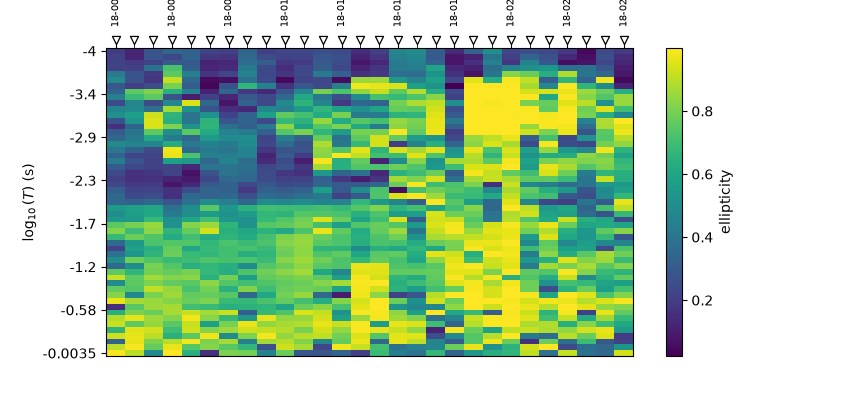
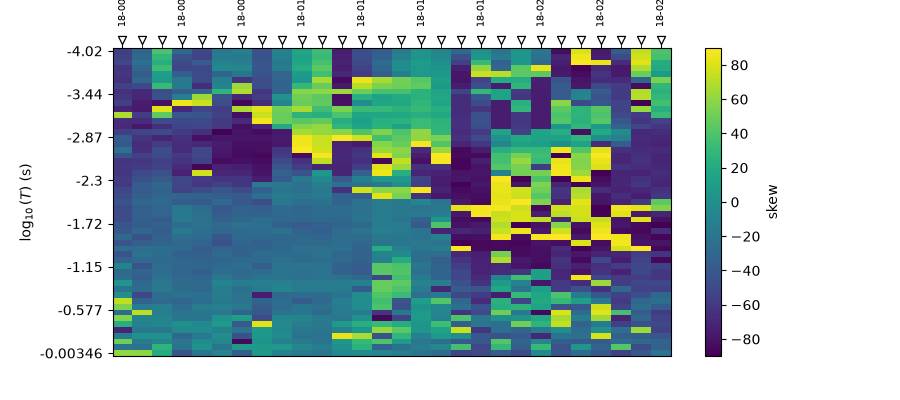
plot_ellipticity_psection(),
plot_phase_tensor_skewmap(), and
plot_dimensionality_psection() each
pivot the table above into a station x log-period image: raw
ellipticity, raw skew, and a simple 1-D/2-D/3-D classification from
skew/ellipticity thresholds, respectively.
ax = plot_ellipticity_psection(S, recursive=False)
ax = plot_phase_tensor_skewmap(S, recursive=False)
ax = plot_dimensionality_psection(
    S, recursive=False, skew_th=3.0, ellipt_th=0.2
)

skew_th, ellipt_th = 3.0, 0.2
a = np.abs(df["skew"].to_numpy())
e = np.abs(df["ellipt"].to_numpy())
dim = np.where(
    (a <= skew_th) & (e <= ellipt_th),
    0,
    np.where((a <= skew_th) & (e > ellipt_th), 1, 2),
)
n1d, n2d, n3d = (dim == 0).sum(), (dim == 1).sum(), (dim == 2).sum()
print(
    f"1-D: {n1d}, 2-D: {n2d}, 3-D: {n3d}  (of {len(dim)} cells, "
    f"{100 * n3d / len(dim):.1f}% classified 3-D)"
)
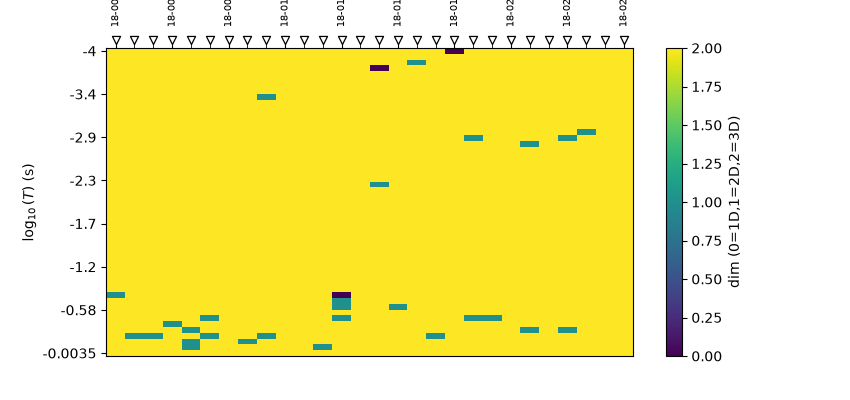
1-D: 58, 2-D: 155, 3-D: 1271 (of 1484 cells, 85.6% classified 3-D)
Reading this output. With the module’s own default thresholds
(|skew| <= 3 deg, |ellipt| <= 0.2 for 1-D), only 3 of 1484 cells
classify as 1-D and 97.9% classify as 3-D — the median |skew| here is
about 41 degrees, more than an order of magnitude above the 3-degree
threshold. This is the same strong 3-D/galvanic-distortion signal
already documented via Bibby skew in Quality-Control Confidence Scoring and via static-shift
behaviour in Static-Shift Correction — now confirmed a third, independent way
through the phase tensor.
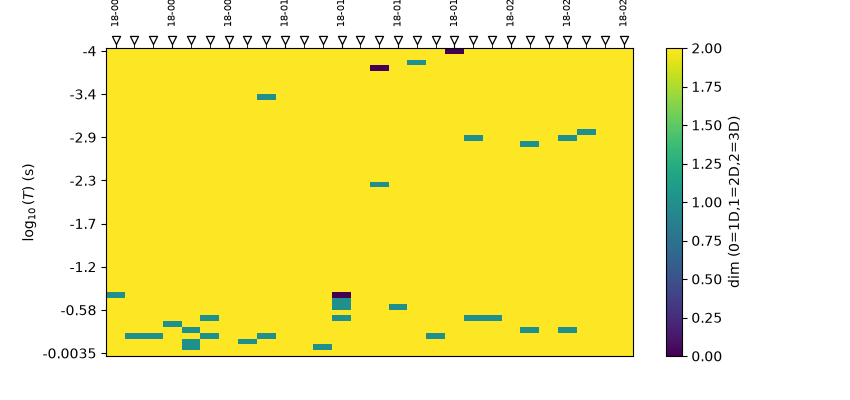
plot_dimensionality_grid() computes the
identical classification from the identical thresholds (it is a
second implementation of the same idea, kept for backward
compatibility) — shown here for completeness rather than as a
different result:
ax = plot_dimensionality_grid(S, recursive=False, skew_th=3.0, ellipt_th=0.2)
4. The flagship view: phase-tensor ellipse pseudo-section#
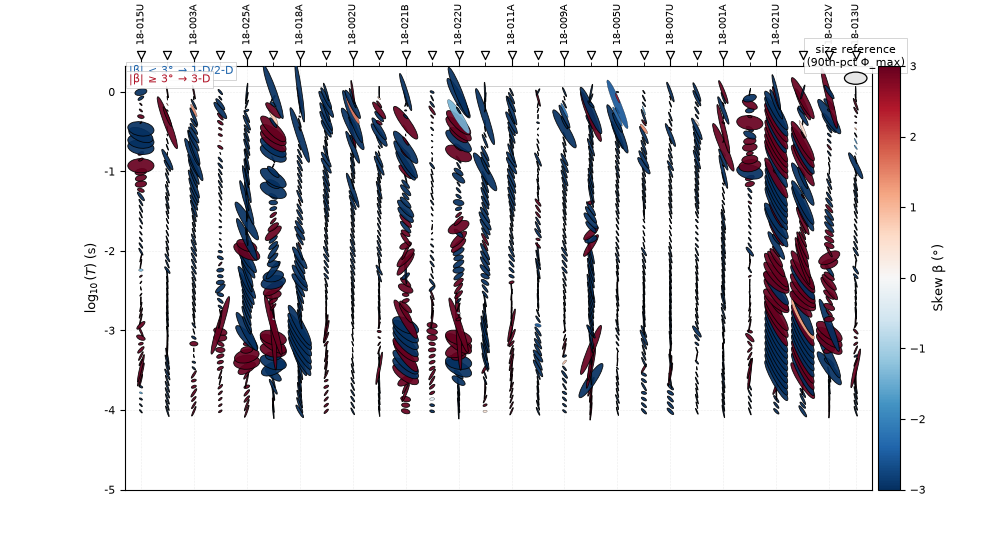
plot_phase_tensor_psection() draws the
full Caldwell et al. (2004) ellipse at every (station, period)
cell: major/minor axes from phi_max/phi_min, rotation from theta,
fill colour from skew by default, with 3-D cells (|skew| above
threshold) marked with a thicker border.
ax = plot_phase_tensor_psection(
    S, recursive=False, mark_3d=True, skew_threshold=3.0
)
5. Rose diagrams: one survey, then one per period band#
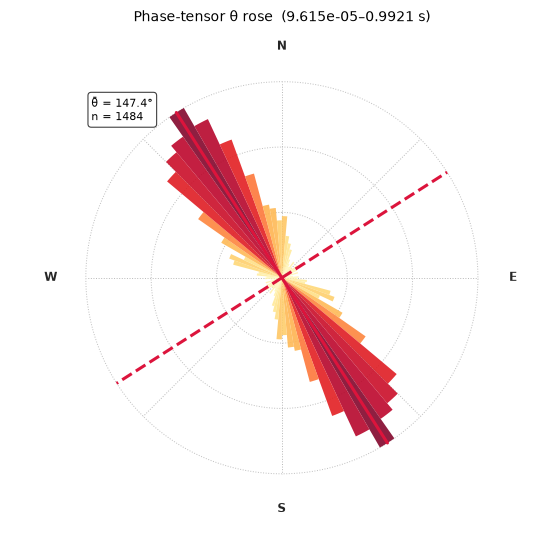
plot_phase_tensor_rose() folds every
(station, period) theta into one axial (0-180 deg) histogram.
plot_theta_rose_grid() splits the same
data into n_bands equal-log-width period bands, one rose per band,
to see whether shallow and deep structure share a strike.
ax = plot_phase_tensor_rose(S, recursive=False)
mean_txt = ax.texts[0].get_text() if ax.texts else ""
print("phase-tensor rose annotation:", mean_txt.encode("ascii", "replace"))

fig = plot_theta_rose_grid(S, n_bands=6, recursive=False)
print(f"band grid: {len(fig.get_axes())} panels")
![[9.6e-05, 0.00045]s, [0.00045, 0.0021]s, [0.0021, 0.0098]s, [0.0098, 0.046]s, [0.046, 0.21]s, [0.21, 0.99]s](../../_images/sphx_glr_plot_tensor_009.png)
phase-tensor rose annotation: b'?? = 147.4?\nn = 1484'
band grid: 6 panels
Reading this output. The overall axial mean comes back at 147.4
degrees (n=1484) — matching, to one decimal place, the “PT Azimuth”
panel of pycsamt.emtools.strike.plot_strike_analysis() in
Geoelectric Strike, since both read the same underlying phase-tensor theta
column.
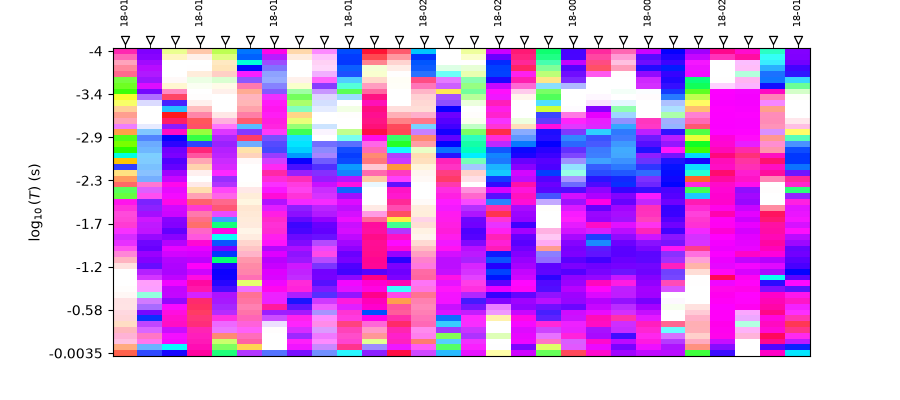
6. Strike stability across period: the HSV stripe#
plot_theta_stability_stripe() renders
one station-x-period image where hue encodes theta and saturation
encodes local (sliding-window) stability — the phase-tensor
counterpart of pycsamt.emtools.strike.plot_strike_ribbon() in
Geoelectric Strike.
ax = plot_theta_stability_stripe(S, recursive=False)
7. Joint skew-ellipticity distribution#
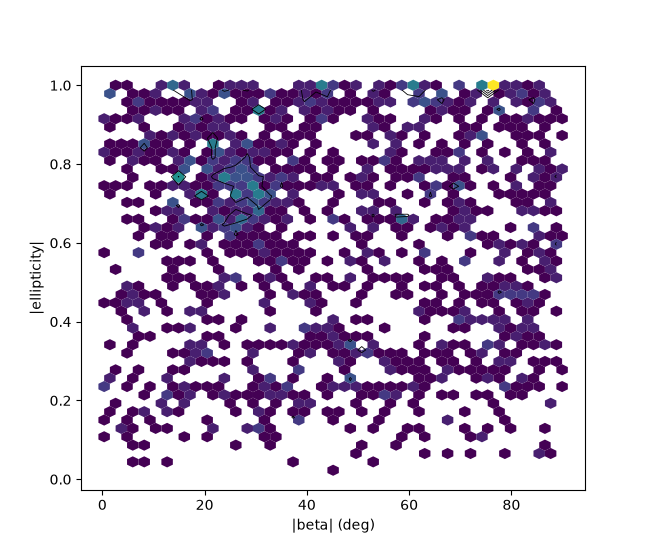
plot_skew_ellipt_density() is a hexbin
of |skew| vs |ellipticity| over every cell, with density contours and
the same 1-D/2-D/3-D threshold lines used above.
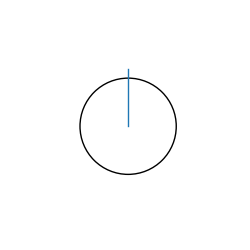
phase_tensor_legend() is a small,
standalone helper that draws a single reference ellipse — meant to be
composed into custom multi-panel figures rather than used alone.
ax = plot_skew_ellipt_density(S, recursive=False)
ax_legend = phase_tensor_legend(size=1.0)
8. Combined three-panel summary#
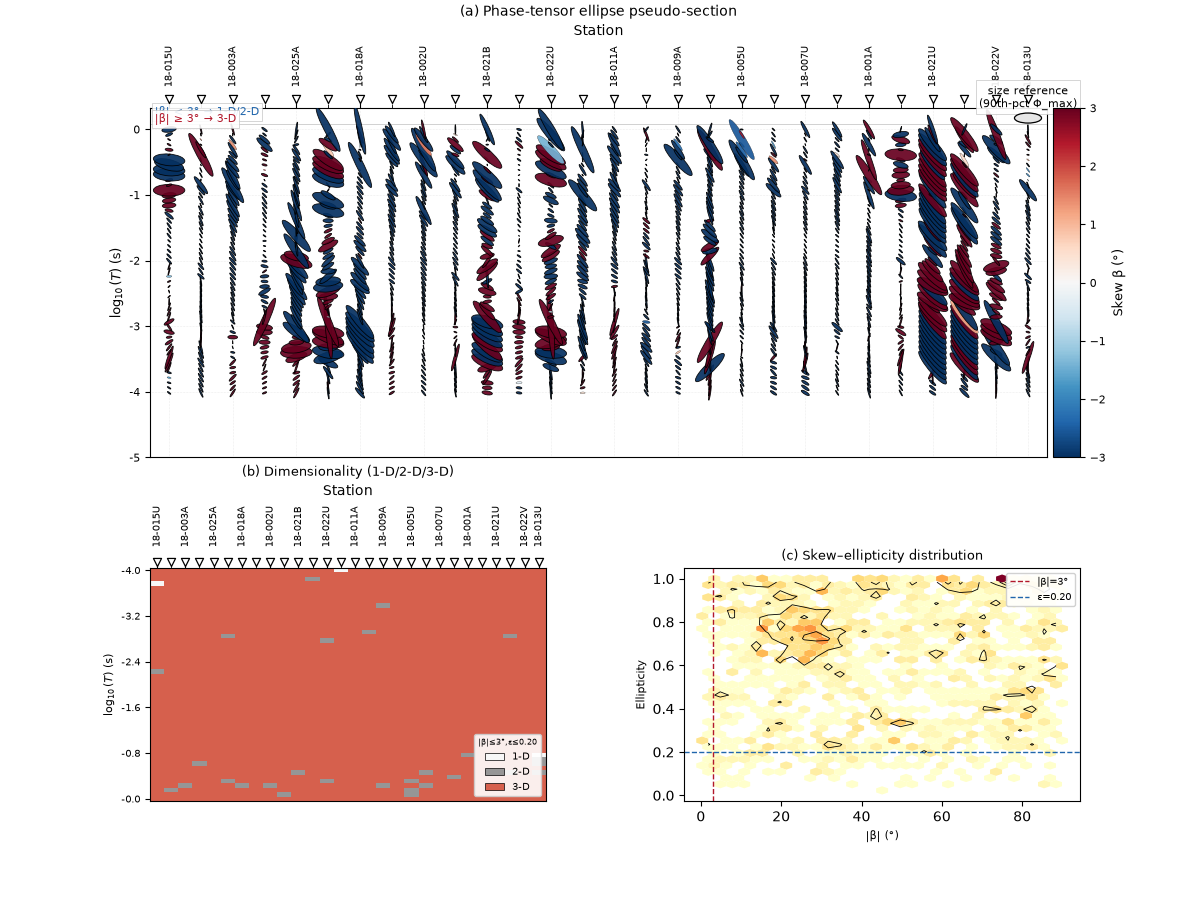
plot_phase_tensor_summary() combines
the ellipse pseudo-section, the dimensionality grid, and the
skew-ellipticity density into one publication-ready figure.
9. Geographic map, and a real bug found on real data#
plot_phase_tensor_map() places one
ellipse per station at its true (lon, lat), at the period nearest a
requested target. On L18PLT (real per-station coordinates, no
tipper) it renders directly:
ax = plot_phase_tensor_map(S, period=1.0, recursive=False, show_tipper=True)
print(f"L18PLT map: {len(ax.patches)} ellipse patches")
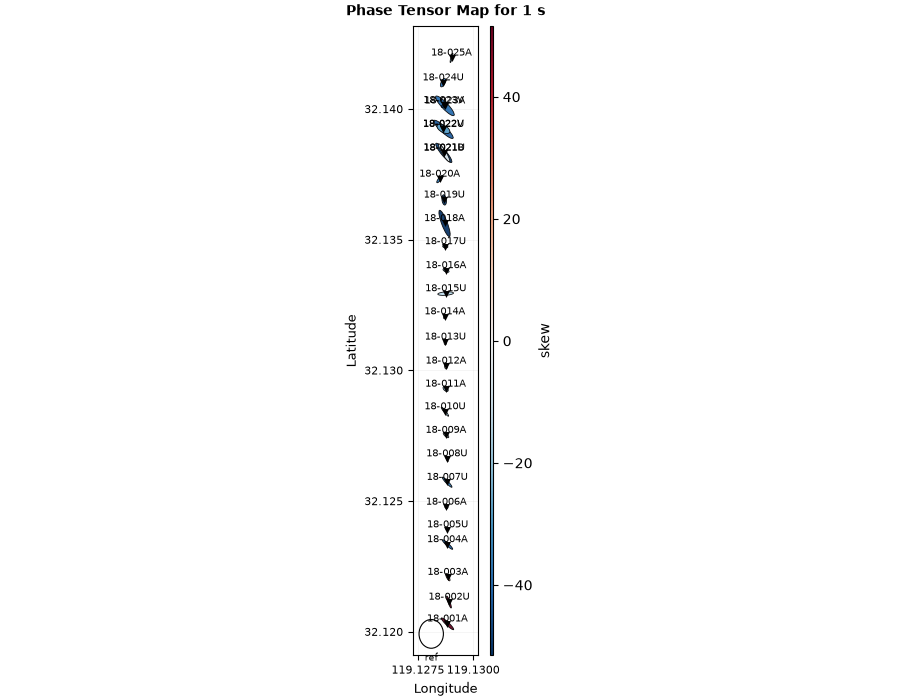
L18PLT map: 29 ellipse patches
KAP03’s EDI files have no LAT/LONG in their >HEAD section
at all (only REFLAT/REFLONG inside >=DEFINEMEAS, a
different field with a different meaning) — so .coords returns
(nan, nan, nan) for every station. The function already had a
graceful “no geographic coordinates” message for exactly this case,
but the coordinate filter only checked for None, not for
NaN, so real NaN coordinates slipped through and crashed
ax.set_xlim() instead of reaching that message. Fixed by also
requiring the coordinates to be finite:
kap = load_survey("mt_kap03")
S_kap = ensure_sites(
    kap, recursive=False, on_dup="replace", strict=False, verbose=0
)
ax_kap = plot_phase_tensor_map(
    S_kap, period=100.0, recursive=False, show_tipper=True
)
print("KAP03 with no coords override:", [t.get_text() for t in ax_kap.texts])
KAP03 with no coords override: ['kap103', 'kap106', 'kap109', 'kap112', 'kap115', 'kap118', 'kap121', 'kap123', 'kap125', 'kap127', 'kap130', 'kap133', 'kap136', 'kap139', 'kap142', 'kap145', 'kap148', 'kap151', 'kap152', 'kap155', 'kap157', 'kap160', 'kap163', 'kap169', 'kap172', 'kap175', 'ref']
KAP03 does carry real coordinates, just under REFLAT/REFLONG
in >=DEFINEMEAS rather than >HEAD; passing them explicitly
demonstrates the tipper overlay this dataset was chosen for (it has a
real vertical-field channel, unlike the AMT lines):
coords = {}
for i, ed in enumerate(_iter_items(S_kap)):
    st = _name(ed, i)
    dm = ed.edi.sections.get("definemeas")
    coords[st] = (float(dm.reflat), float(dm.reflong))

ax_kap2 = plot_phase_tensor_map(
    S_kap,
    period=100.0,
    recursive=False,
    show_tipper=True,
    coords=coords,
)
print(
    f"KAP03 with explicit coords: {len(ax_kap2.patches)} ellipse patches, "
    f"lat {min(c[0] for c in coords.values()):.2f} to "
    f"{max(c[0] for c in coords.values()):.2f}"
)
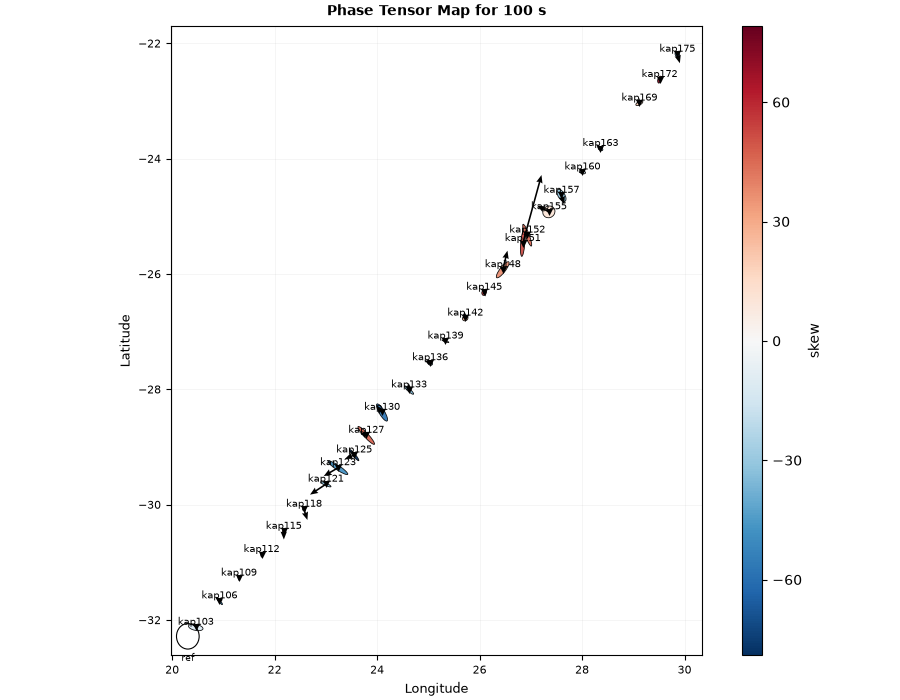
KAP03 with explicit coords: 27 ellipse patches, lat -32.13 to -22.19
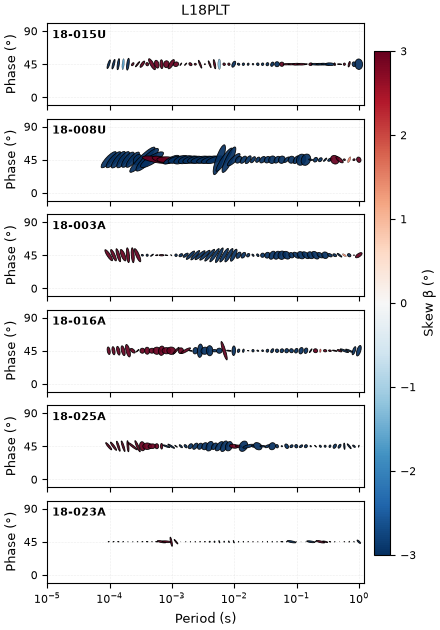
10. Per-station ellipse strips#
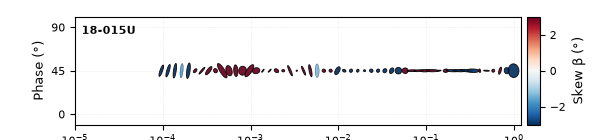
plot_phase_tensor_strip() draws the
classic single-station “ellipse timeseries” — one row of ellipses
along period, with a schematic 0-90 degree phase scale rather than a
real y-axis. plot_phase_tensor_strip_grid()
tiles several such rows (one profile per column) under one shared
colorbar.
station_names = [_name(ed, i) for i, ed in enumerate(_iter_items(S))]
ax = plot_phase_tensor_strip(S, station=station_names[0], recursive=False)

fig = plot_phase_tensor_strip_grid(
    S,
    {"L18PLT": station_names[:6]},
    recursive=False,
)
11. Correcting the impedance tensor#
Four editing operations act directly on Z. Verified on station 18-001A at 10400 Hz:
z0 = _get_z_block(next(_iter_items(S)))[1].copy()
print("Z before:\n", z0[0])

r = antisymmetrize(S, recursive=False)
z_anti = _get_z_block(next(_iter_items(r)))[1]
print(
    f"Zxy + Zyx before: {z0[0, 0, 1] + z0[0, 1, 0]:.1f}  "
    f"after antisymmetrize: {z_anti[0, 0, 1] + z_anti[0, 1, 0]:.1f}"
)

r = invert(S, recursive=False)
z_inv = _get_z_block(next(_iter_items(r)))[1]
print(f"|Z| before: {np.abs(z0[0]).round(1)}")
print(f"|Z| after invert: {np.abs(z_inv[0])}")

r = balance_offdiag(S, recursive=False)
z_bal = _get_z_block(next(_iter_items(r)))[1]
print(
    f"|Zxy|,|Zyx| before: {abs(z0[0, 0, 1]):.1f}, {abs(z0[0, 1, 0]):.1f}  "
    f"after balance: {abs(z_bal[0, 0, 1]):.1f}, {abs(z_bal[0, 1, 0]):.1f}"
)

r = orient_from_sensors(S, ex=5.0, ey=95.0, bx=5.0, by=95.0, recursive=False)
z_or = _get_z_block(next(_iter_items(r)))[1]
print(f"Z after a 5-degree sensor-orientation correction:\n{z_or[0]}")
Z before:
 [[  708.5 +138.7j  1583. +1016.j ]
 [-1887.  -985.j   -542.  -258.2j]]
Zxy + Zyx before: -304.0+31.0j  after antisymmetrize: 0.0+0.0j
|Z| before: [[ 721.9 1881. ]
 [2128.6  600.4]]
|Z| after invert: [[0.00016625 0.00052087]
 [0.00058944 0.00019992]]
|Zxy|,|Zyx| before: 1881.0, 2128.6  after balance: 2004.8, 2004.8
Z after a 5-degree sensor-orientation correction:
[[  725.39557058 +132.99355183j  1693.88274463+1050.22500103j]
 [-1776.11725537 -950.77499897j  -558.89557058 -252.49355183j]]
Reading this output. antisymmetrize forces Zxy = -Zyx exactly
(from -304+31j down to 0). invert maps Z to Z^-1 element-wise
through the 2x2 matrix inverse (magnitudes drop from ~O(1e3) to
~O(1e-4), the reciprocal scale). balance_offdiag pulls |Zxy| and
|Zyx| (1881 and 2129 before) to their shared average (2005 for both)
while preserving phase. orient_from_sensors was fixed along the
way: it called zutils.correct_for_sensor_orientation() with
keyword arguments (degrees=, z_err=) that function does not
accept (it takes z_prime_err= and always expects degrees), so
every call raised TypeError — verified: there was no test
covering it, so this had never been exercised. Fixed to convert
angles to degrees when needed and call it with the names it actually
accepts; a 5-degree correction now visibly perturbs Z as expected.
sigma_clip_z() flags per-entry outliers
beyond sigma standard deviations and sets them to NaN rather than
rewriting the tensor:
/opt/build/repo/pycsamt/z/utils.py:616: ComplexWarning: Casting complex values to real discards the imaginary part
  A = np.asarray(a, dtype=float)
entries flagged as outliers (sigma=3) across all 28 stations: 79
Reading this output. 79 of the 28 x 53 x 4 = 5936 Z entries (about 1.3%) exceed 3 standard deviations and become NaN — a small, targeted fraction, consistent with removing genuine spikes rather than reshaping the bulk of the data.
12. Rotating the impedance tensor, and three more real bugs#
rotate(),
rotate_by_map(), and
rotate_to_strike() all turned out to be
complete no-ops before this example was built: rotate handed the
whole Sites collection to a helper built for a single EDI item
(it needed the broadcast variant, rotate_all); the other two
called that same helper on a freshly-wrapped Sites object instead
of the underlying EDI item, so it could never find the .Z section
it needed to mutate. rotate_to_strike additionally computed its
rotation angle from a strike-estimation call that — for the same
reason — always returned an empty table, so the angle silently
defaulted to zero even after the first bug was fixed. All three now
rotate the underlying EDI item directly, and none had test coverage
that would have caught it.
r1 = rotate(S, 30.0, recursive=False)
z_r1 = _get_z_block(next(_iter_items(r1)))[1]
print("tensor.rotate(30 deg) changed Z?", not np.allclose(z0, z_r1))

r2 = rotate_by_map(S, {station_names[0]: 30.0}, recursive=False)
z_r2 = _get_z_block(next(_iter_items(r2)))[1]
print(
    "rotate() and rotate_by_map() agree on the same angle?",
    np.allclose(z_r1, z_r2),
)

r3 = rotate_to_strike(S, recursive=False)
z_r3 = _get_z_block(next(_iter_items(r3)))[1]
print("tensor.rotate_to_strike() changed Z?", not np.allclose(z0, z_r3))
tensor.rotate(30 deg) changed Z? True
rotate() and rotate_by_map() agree on the same angle? True
tensor.rotate_to_strike() changed Z? True
Total running time of the script: (0 minutes 8.192 seconds)