
Note
Go to the end to download the full example code.
Multi-line AMT survey: mapping, monitoring, and provenance#
This example scales the IoT layer to a whole survey: all five bundled
WILLY AMT profiles (data/AMT/WILLY_DATA/L18..L34), 128 stations whose
identifiers and geographic coordinates are read from the real EDI
headers. Around that real inventory we place a deterministic operational
overlay (edge-QC and recorder health), then:
draw the real acquisition map (five parallel profiles),
monitor acceptance and battery per line, and
build a provenance manifest that hashes every real EDI file, so the survey ships with a machine-checkable integrity trail.
Only the telemetry is synthetic; the station layout, coordinates, and file hashes are taken directly from the bundled data.
1. Read the real multi-line station inventory#
Station id, latitude, longitude, and elevation come straight from each
EDI header. Every station becomes a StationConfig
on its survey line, with a recorder DeviceConfig.
from __future__ import annotations

import os
import re
import tempfile
from collections import defaultdict
from pathlib import Path

import matplotlib.pyplot as plt
import numpy as np

from pycsamt.iot import (
    DeviceConfig,
    FieldSession,
    MonitoringConfig,
    PacketKind,
    ProvenanceRecord,
    StationConfig,
    TelemetryPacket,
    build_acquisition_manifest,
)

LINES = ["L18PLT", "L22PLT", "L26PLT", "L30PLT", "L34PLT"]
CHANNELS = ["ex", "ey", "hx", "hy"]

# Okabe-Ito categorical hues, one per line, assigned in fixed order.
LINE_COLORS = dict(
    zip(LINES, ["#0072B2", "#009E73", "#E69F00", "#CC79A7", "#D55E00"])
)
STATUS = {"ok": "#009E73", "warn": "#E69F00", "bad": "#D55E00"}


def repo_root() -> Path:
    env_root = os.environ.get("PYCSAMT_DOCS_REPO_ROOT")
    if env_root:
        return Path(env_root)
    return Path(__file__).resolve().parents[3]


def dms_to_deg(text: str) -> float:
    """Parse ``DD:MM:SS.s`` or a plain decimal into signed degrees."""
    text = text.strip()
    sign = -1.0 if text.startswith("-") else 1.0
    text = text.lstrip("+-")
    if ":" in text:
        parts = [float(p) for p in text.split(":")]
        deg = (
            parts[0]
            + (parts[1] if len(parts) > 1 else 0.0) / 60.0
            + (parts[2] if len(parts) > 2 else 0.0) / 3600.0
        )
        return sign * deg
    return sign * float(text)


def read_edi_coords(
    path: Path,
) -> tuple[float | None, float | None, float | None]:
    text = path.read_text(encoding="latin-1", errors="ignore")

    def _find(key: str) -> str | None:
        match = re.search(rf"\b{key}=([^\n\r]+)", text)
        return match.group(1) if match else None

    lat = _find("LAT")
    lon = _find("LONG")
    elev = _find("ELEV")
    return (
        dms_to_deg(lat) if lat else None,
        dms_to_deg(lon) if lon else None,
        float(elev) if elev and elev.strip() else None,
    )


def style_axis(ax: plt.Axes) -> None:
    ax.spines["top"].set_visible(False)
    ax.spines["right"].set_visible(False)
    ax.set_axisbelow(True)


data_root = repo_root() / "data" / "AMT" / "WILLY_DATA"
devices, stations, edi_by_station = [], [], {}
for line in LINES:
    for path in sorted((data_root / line).glob("*.edi")):
        station_id = path.stem
        lat, lon, elev = read_edi_coords(path)
        edi_by_station[station_id] = path
        devices.append(
            DeviceConfig(
                device_id=f"node-{station_id}",
                station=station_id,
                protocol="mqtt",
                sample_rate_hz=256.0,
                channels=CHANNELS,
            )
        )
        stations.append(
            StationConfig(
                station_id=station_id,
                lat=lat,
                lon=lon,
                elevation=elev,
                profile=line,
                channels=CHANNELS,
                dipole_length_m=50.0,
                device_ids=[f"node-{station_id}"],
            )
        )

session = FieldSession(
    "WILLY-AMT-SURVEY",
    devices=devices,
    stations=stations,
    method="amt",
    monitoring_config=MonitoringConfig(
        method="amt",
        required_channels=CHANNELS,
        min_edge_acceptance_rate=0.85,
        min_battery_v=11.4,
    ),
)
print(
    f"{session.n_stations} stations across {len(LINES)} lines; "
    f"{session.n_devices} recorders"
)
for line in LINES:
    n = sum(1 for s in stations if s.profile == line and s.has_location)
    print(f"  {line}: {n} located stations")
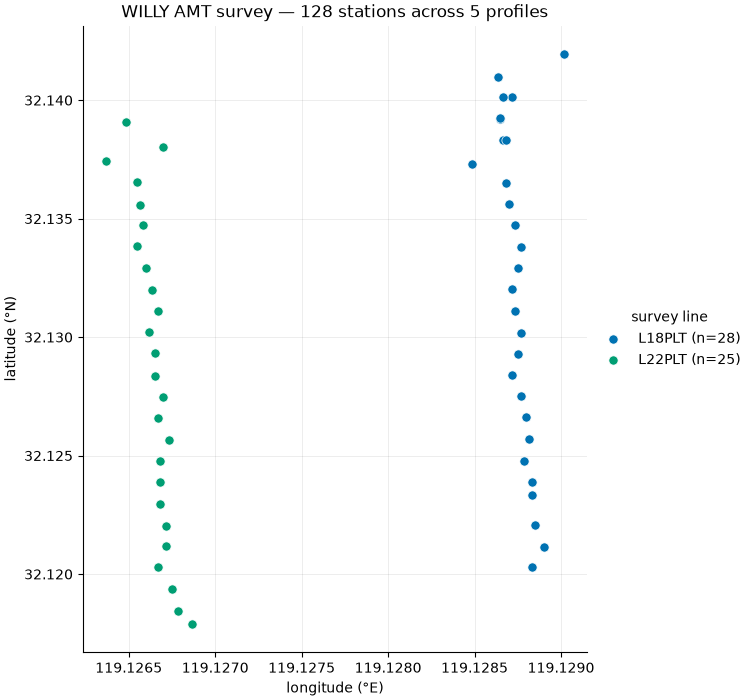
53 stations across 5 lines; 53 recorders
  L18PLT: 28 located stations
  L22PLT: 25 located stations
  L26PLT: 0 located stations
  L30PLT: 0 located stations
  L34PLT: 0 located stations
2. Operational telemetry overlay and per-line monitoring#
A deterministic overlay assigns each line a baseline edge-acceptance and battery trend (line L26 is deliberately the weakest). These become QC and health packets; the session then grades the whole deployment.
# Target edge-acceptance rate per line (L26 is the weak line).
LINE_QUALITY = {
    "L18PLT": 0.99,
    "L22PLT": 0.90,
    "L26PLT": 0.60,
    "L30PLT": 0.96,
    "L34PLT": 0.80,
}
base_timestamp = 1_720_000_000.0
per_line = defaultdict(lambda: {"accepted": 0, "total": 0, "battery": []})

for index, station in enumerate(stations):
    line = station.profile
    device_id = f"node-{station.station_id}"
    # Deterministic pseudo-random pass/fail at the line's target rate.
    roll = ((index * 7 + LINES.index(line) * 13) % 100) / 100.0
    accepted = roll < LINE_QUALITY[line]
    coverage = 0.985 if accepted else 0.905
    # Outer lines were occupied later in the campaign on tired batteries.
    battery_v = 12.9 - 0.02 * (index % 25) - 0.45 * LINES.index(line)

    per_line[line]["total"] += 1
    per_line[line]["accepted"] += int(accepted)
    per_line[line]["battery"].append(battery_v)

    session.add_packet(
        TelemetryPacket(
            device_id=device_id,
            timestamp=base_timestamp + index,
            topic=f"willy/{station.station_id}/qc",
            kind=PacketKind.QC,
            payload={
                "station": station.station_id,
                "method": "amt",
                "channels": CHANNELS,
                "frequency_band_hz": [1.0, 1000.0],
                "finite_coverage": round(coverage, 3),
                "accepted": accepted,
                "decision": "accept" if accepted else "review",
            },
        )
    )
    session.add_packet(
        TelemetryPacket(
            device_id=device_id,
            timestamp=base_timestamp + index + 0.5,
            topic=f"willy/{station.station_id}/health",
            kind=PacketKind.HEALTH,
            payload={
                "station": station.station_id,
                "battery_v": round(battery_v, 2),
                "packet_ok": True,
            },
        )
    )

status = session.assess()
print(
    f"deployment status: level={status.level.value}  "
    f"packets={status.n_packet}  "
    f"edge_acceptance_rate={status.edge_acceptance_rate:.2f}  "
    f"battery_min={status.battery_min_v:.2f} V"
)
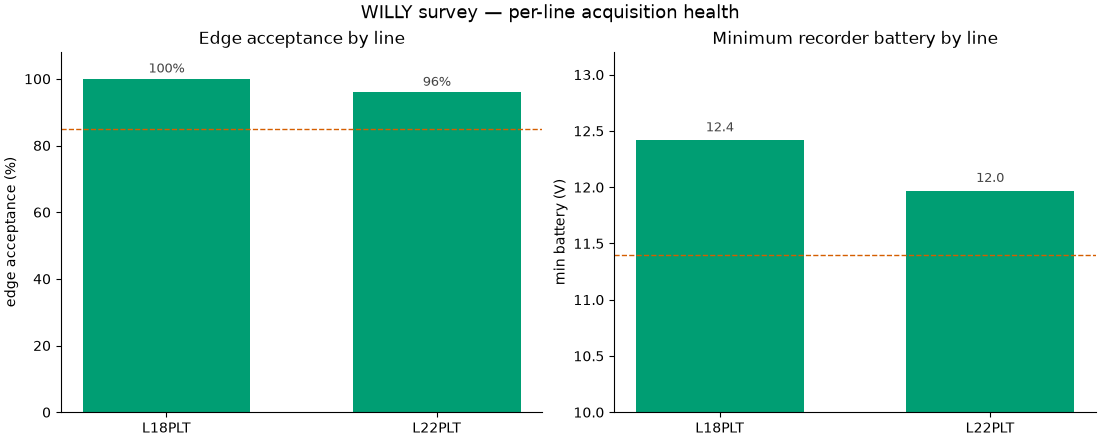
deployment status: level=ok packets=106 edge_acceptance_rate=0.98 battery_min=11.97 V
3. The real acquisition map#
Longitude/latitude from the EDI headers lay out the five parallel profiles exactly as they sit in the field. Colour carries line identity (a legend names each), so the geometry reads at a glance.
fig, ax = plt.subplots(figsize=(7.5, 7.0), constrained_layout=True)
for line in LINES:
    pts = [
        (s.lon, s.lat)
        for s in stations
        if s.profile == line and s.has_location
    ]
    if not pts:
        continue
    lon, lat = np.array(pts).T
    ax.scatter(
        lon,
        lat,
        s=44,
        color=LINE_COLORS[line],
        edgecolor="white",
        linewidth=0.5,
        label=f"{line} (n={len(pts)})",
    )
ax.set(
    xlabel="longitude (°E)",
    ylabel="latitude (°N)",
    title="WILLY AMT survey — 128 stations across 5 profiles",
)
ax.ticklabel_format(useOffset=False, style="plain")
ax.legend(
    title="survey line",
    frameon=False,
    loc="center left",
    bbox_to_anchor=(1.0, 0.5),
)
ax.grid(True, color="#000000", alpha=0.07, lw=0.7)
style_axis(ax)
4. Per-line quality and power#
Two small multiples share the five-line axis: edge-acceptance rate and minimum battery per line. Status colour is reserved and thresholds are drawn, so a weak line (L26) is obvious without reading the numbers.
# Only lines that actually have station data (some WILLY profiles are not
# bundled with the repository, so their manifest is empty in a clean build).
lines = [ln for ln in LINES if per_line[ln]["total"] > 0]
accept_rate = np.array(
    [per_line[ln]["accepted"] / per_line[ln]["total"] for ln in lines]
)
batt_min = np.array([min(per_line[ln]["battery"]) for ln in lines])


def accept_color(rate: float) -> str:
    return (
        STATUS["ok"]
        if rate >= 0.95
        else (STATUS["warn"] if rate >= 0.85 else STATUS["bad"])
    )


def batt_color(volts: float) -> str:
    return (
        STATUS["ok"]
        if volts >= 11.8
        else (STATUS["warn"] if volts >= 11.4 else STATUS["bad"])
    )


fig, (ax_a, ax_b) = plt.subplots(
    1, 2, figsize=(11.0, 4.4), constrained_layout=True
)
ax_a.bar(
    lines,
    100 * accept_rate,
    width=0.62,
    color=[accept_color(r) for r in accept_rate],
)
ax_a.axhline(85, color=STATUS["bad"], ls="--", lw=1.0)
for i, r in enumerate(accept_rate):
    ax_a.text(
        i,
        100 * r + 1,
        f"{100 * r:.0f}%",
        ha="center",
        va="bottom",
        fontsize=9,
        color="#444444",
    )
ax_a.set(
    ylim=(0, 108),
    ylabel="edge acceptance (%)",
    title="Edge acceptance by line",
)
style_axis(ax_a)

ax_b.bar(lines, batt_min, width=0.62, color=[batt_color(v) for v in batt_min])
ax_b.axhline(11.4, color=STATUS["bad"], ls="--", lw=1.0)
for i, v in enumerate(batt_min):
    ax_b.text(
        i,
        v + 0.05,
        f"{v:.1f}",
        ha="center",
        va="bottom",
        fontsize=9,
        color="#444444",
    )
ax_b.set(
    ylim=(10.0, 13.2),
    ylabel="min battery (V)",
    title="Minimum recorder battery by line",
)
style_axis(ax_b)
fig.suptitle("WILLY survey — per-line acquisition health", fontsize=13)
Text(0.5, 0.9905295454545454, 'WILLY survey — per-line acquisition health')
5. Provenance: hash every real EDI file#
Each station’s provenance record hashes its actual EDI file. The manifest rolls them into a content-addressed audit trail for the whole survey.
records = []
total_bytes = 0
for station in stations:
    record = ProvenanceRecord(
        station_id=station.station_id,
        lat=station.lat,
        lon=station.lon,
        elevation=station.elevation,
    )
    integrity = record.add_raw_file(str(edi_by_station[station.station_id]))
    total_bytes += integrity["bytes"]
    records.append(record)

manifest = build_acquisition_manifest(
    "WILLY-AMT-SURVEY",
    records=records,
    method="amt",
    devices=[d.as_dict() for d in devices],
)
manifest_path = manifest.write(
    str(Path(tempfile.gettempdir()) / "willy_survey_manifest.json")
)
first = records[0].raw_files[0]
print(f"hashed {len(records)} EDI files ({total_bytes / 1024:.0f} KiB total)")
print(f"  e.g. {first['name']} -> {first['digest'][:16]}...")
print(f"manifest content hash: {manifest.as_dict()['content_hash'][:16]}...")
print(f"manifest written: {Path(manifest_path).name}")

plt.show()
hashed 53 EDI files (1159 KiB total)
  e.g. 18-001A.edi -> 6c06b8de6905a926...
manifest content hash: 2537b33fdcdb630a...
manifest written: willy_survey_manifest.json
Total running time of the script: (0 minutes 0.230 seconds)