
3-D maps#
Interactive survey mapping with pycsamt.map — from a flat station
map to fully three-dimensional fence diagrams, resistivity blocks, and
topography-draped volumes. Every figure below is a live Plotly scene:
rotate, zoom, and hover directly in the page.
The gallery builds from simple to complex:
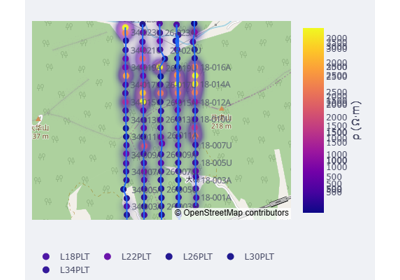
Station maps — plan-view station locations coloured by index, apparent resistivity, or phase, with contours, labels, and themes;
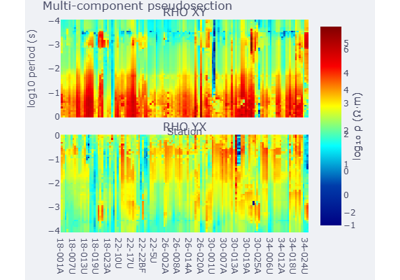
Profiles and pseudo-sections — per-line resistivity/phase sections;
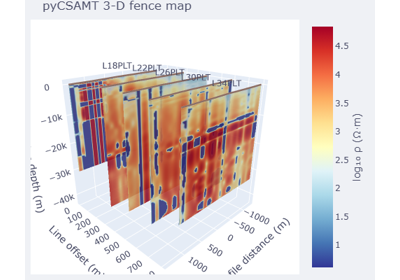
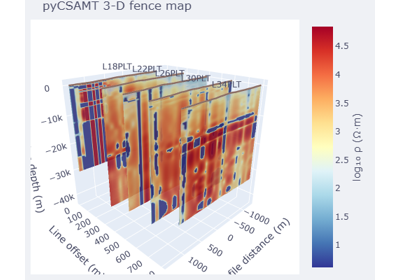
3-D fence diagrams — each survey line as a hanging cross-section in a shared 3-D scene;
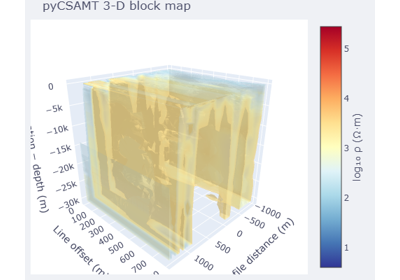
3-D blocks, depth slices, and surfaces — the interpolated resistivity volume rendered four different ways;
Topography — draping the survey and its sections over real elevation;
Advanced compositions — custom volume options, multiple quantities, and viewpoint control.
All examples use the bundled WILLY_DATA AMT survey
(data/AMT/WILLY_DATA/ — 5 lines, 128 stations). The high-level
MapView façade loads the survey once and produces
every view; see the Map tools guide for the full API.
Note
Rendering these examples requires plotly and kaleido
(pip install plotly kaleido). The maps are also available as a live
Dash workbench — see pycsamt.map.launch_mapview().
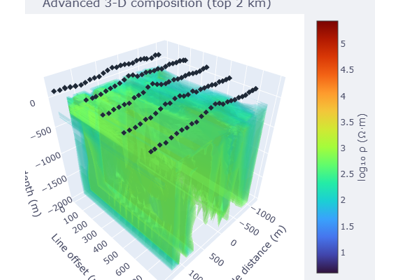
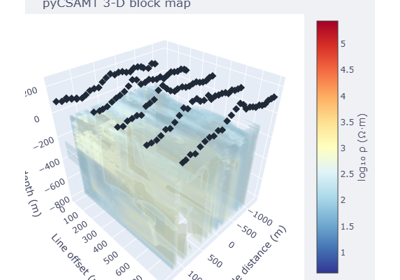
Near-surface 3-D view with topography and stations
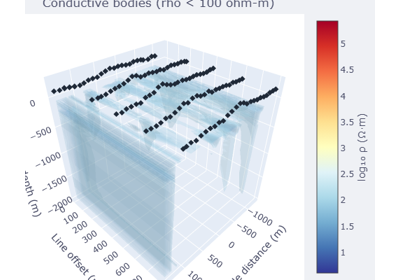
Isolating resistive, conductive, and background bodies