Processing pipeline#
pycsamt.pipeline chains the individual processing tools into one
reproducible, auditable workflow — from raw Sites to
publication-ready EDIs, QC plots, and a run report — driven by short step
codes, presets, or a config file.
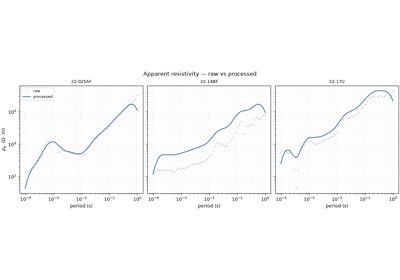
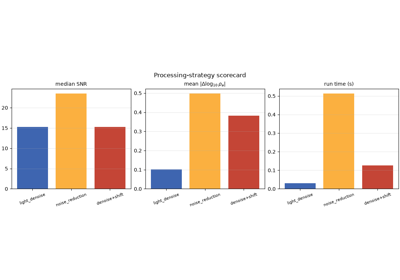
These examples are information-first: the point is not the pictures but the workflow itself — what steps exist, how a run is assembled, what it produces, and how to reproduce it. Each script prints the meaningful output (step catalogues, per-step timings, run summaries, the reproducible config) and ends with one small summary figure.
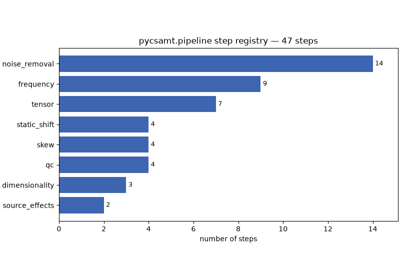
Step catalogue — the built-in processing steps, by category, and how to inspect one;
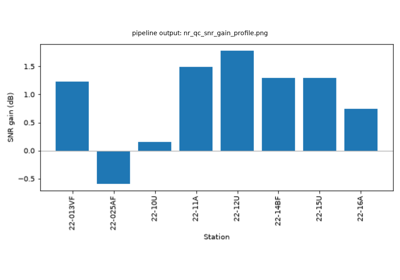
Build and run — assemble a pipeline of steps, run it on a real survey line, and read the
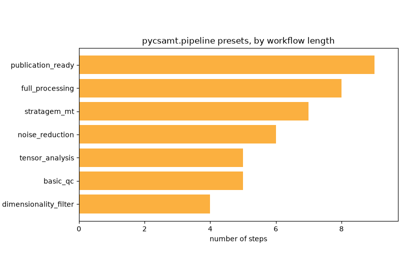
PipelineResultand its output package;Presets — ready-made recipes (
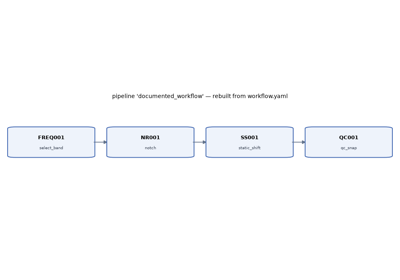
basic_qc,full_processing…) you can run in one line;Config and reproducibility — serialise a pipeline to YAML and rebuild it exactly with
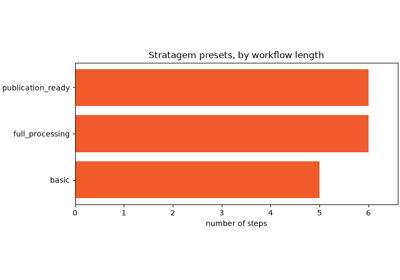
Pipeline.from_yaml();Stratagem presets — instrument-specific end-to-end workflows.
Runs use the bundled WILLY_DATA L22 line
(data/AMT/WILLY_DATA/L22PLT/). See the pipeline API reference for the full listing.