
Note
Go to the end to download the full example code.
Build and run a pipeline#
This is the core workflow: assemble an ordered list of
Step s, run them on a survey with
Pipeline.run(), and read the PipelineResult
— per-step timings, the run summary, and the on-disk output package (cleaned
EDIs, QC plots, and a reproducible config).
Assemble the pipeline#
Each entry is a (label, Step(code, **params)) pair; the steps run in
order. This chain de-duplicates and band-limits frequencies, aligns the
frequency axis, notches the 50 Hz power line, then snaps a QC summary.
from _pipe_data import demo_sites, quiet_logs, scratch_dir

from pycsamt.pipeline import (
    Pipeline,
    Step,
    configure_pipe,
    reset_pipe,
)

sites = demo_sites(n=8)
print(f"loaded {len(sites)} stations from WILLY_DATA L22")

pipe = Pipeline(
    [
        ("drop_dup", Step("FREQ002")),
        ("select_band", Step("FREQ001", band_hz=(0.01, 10_000))),
        ("align", Step("FREQ004")),
        ("notch", Step("NR001", mains_hz=50)),
        ("qc_snap", Step("QC001")),
    ],
    name="willy_l22_demo",
)
print(pipe)
loaded 8 stations from WILLY_DATA L22
Pipeline  'willy_l22_demo'  ─────────────────────────────────────────────  5 steps
  ( 1) drop_dup     [FREQ002]  Drop Duplicate Frequencies
  ( 2) select_band  [FREQ001]  Frequency Band Select       band_hz=(0.01, 10000)
  ( 3) align        [FREQ004]  Frequency Grid Alignment
  ( 4) notch        [NR001]    Power-line Harmonic Notch   mains_hz=50  n_harm=30  tol_hz=0.08
  ( 5) qc_snap      [QC001]    QC Quick-Look Snapshot
────────────────────────────────────────────────────────────────────────────────
Run it#
Pipeline.run() executes every step, writes outputs to outdir,
and returns the result. configure_pipe just turns off the progress bar
and sets a light plot DPI for the docs build.
configure_pipe(show_progress=False, plot_dpi=72, plot_fmt="png")
outdir = scratch_dir()

with quiet_logs():
    result = pipe.run(
        sites,
        outdir=outdir,
        save_plots=True,
        save_edis=True,
        save_report=True,
    )

print(result.summary())
PipelineResult  'willy_l22_demo'
  Sites   : 8 in → 8 out
  Steps   : 5 (5 ok, 0 err)
  Time    : 1.56 s
  Plots   : 9
  Output  : /tmp/pycsamt_pipe_untx9lzi
Read the result#
PipelineResult exposes the run at every level:
overall status, and a StepResult per step with
its timing and in/out station counts — the audit trail of what happened.
print(
    f"ok = {result.ok}   errors = {result.n_errors}   "
    f"elapsed = {result.elapsed_sec:.2f} s\n"
)
print(f"{'step':<12}{'code':<9}{'ok':<5}{'seconds':>8}{'sites':>10}")
for sr in result.step_results:
    print(
        f"{sr.step_name:<12}{sr.step_code:<9}{str(sr.ok):<5}"
        f"{sr.elapsed_sec:>8.3f}{f'{sr.n_sites_in}->{sr.n_sites_out}':>10}"
    )
ok = True   errors = 0   elapsed = 1.56 s

step        code     ok    seconds     sites
drop_dup    FREQ002  True    0.100      8->8
select_band FREQ001  True    0.414      8->8
align       FREQ004  True    0.126      8->8
notch       NR001    True    0.148      8->8
qc_snap     QC001    True    0.769      8->8
The output package#
The run leaves a self-contained folder: the cleaned EDIs, the QC figures
each plotting step produced, and pipeline.yaml — the recipe needed to
reproduce the run (see Config-driven pipelines and reproducibility).
20 files written to the output directory:
   pipeline.yaml
   plots/01_drop_dup/plot_coverage_quality_heatmap.png
   plots/02_select_band/plot_band_microstrips.png
   plots/02_select_band/plot_coverage_quality_heatmap.png
   plots/03_align/plot_coverage_quality_heatmap.png
   plots/04_notch/nr_qc_harmonic_waterfall.png
   plots/04_notch/nr_qc_snr_gain_profile.png
   plots/05_qc_snap/plot_coverage_psection.png
   plots/05_qc_snap/plot_qc_quicklook.png
   plots/05_qc_snap/plot_station_confidence_dashboard.png
   processed/22-013VF.edi
   processed/22-025AF.edi
   processed/22-10U.edi
   processed/22-11A.edi
   processed/22-12U.edi
   processed/22-14BF.edi
   processed/22-15U.edi
   processed/22-16A.edi
   report.html
   summary.txt
What a step produced#
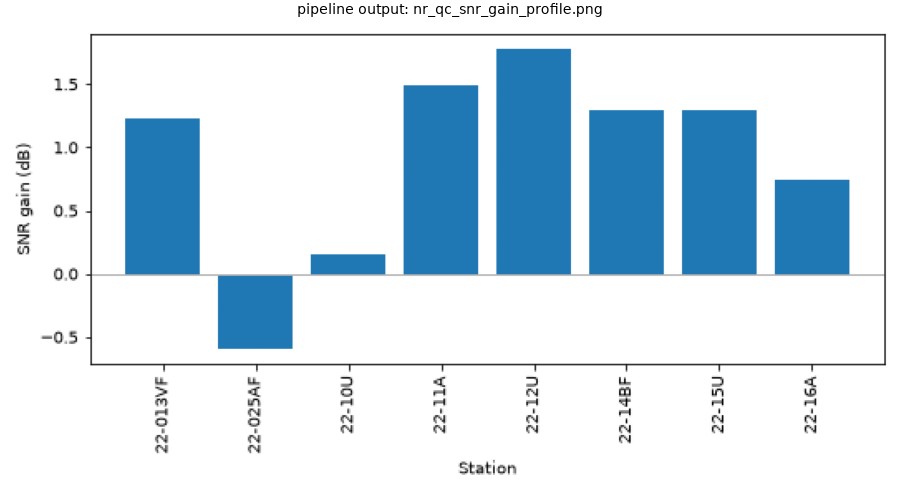
Since save_plots=True, the QC step wrote real diagnostic figures. Here
is one of them, loaded straight from the output package — this is the
pipeline’s own output, not a plot made for this page.
import matplotlib.image as mpimg
import matplotlib.pyplot as plt

pngs = sorted(outdir.rglob("*.png"))
pick = next((p for p in pngs if "snr" in p.name.lower()), pngs[0])
img = mpimg.imread(pick)
fig, ax = plt.subplots(figsize=(9, 5.0), constrained_layout=True)
ax.imshow(img)
ax.set_axis_off()
ax.set_title(f"pipeline output: {pick.name}", fontsize=10)

reset_pipe()
Takeaway. A pipeline turns a list of step codes into a fully documented run — cleaned data, QC figures, timings, and a reproducible config — in one call. The next examples package common chains as presets and reproduce runs from config files.
Total running time of the script: (0 minutes 1.693 seconds)