
9.5. Method-Aware QC#
An EMMethod names the survey method, but
on its own it changes no threshold. The pycsamt.iot.methods module
carries the canonical, per-method knowledge that turns a method name into
concrete QC defaults, so the same monitor behaves correctly for
AMT, MT, CSAMT, CSEM, and TDEM/TEM
without hand-tuning. Everything on this page reads from that one small
table of defaults — nothing here is a new diagnostic in its own right.
9.5.1. Method Profiles#
A MethodProfile records the typical
acquisition band, the channels a valid record must carry, a nominal
sample rate, and whether the method uses a controlled source or is
sensitive to powerline noise — together, this is the method
profile behind every method-aware default on this page:
>>> from pycsamt.iot import method_profile
>>> p = method_profile("csamt")
>>> print(f"frequency_band_hz: {p.frequency_band_hz}")
frequency_band_hz: (0.125, 8192.0)
>>> print(f"required_channels: {p.required_channels}")
required_channels: ('ex', 'ey', 'hx', 'hy')
>>> print(f"default_sample_rate_hz: {p.default_sample_rate_hz}")
default_sample_rate_hz: 32768.0
>>> print(f"controlled_source: {p.controlled_source}")
controlled_source: True
>>> print(f"powerline_sensitive: {p.powerline_sensitive}")
powerline_sensitive: True
Method |
Band (Hz) |
Required channels |
Source |
Powerline |
|---|---|---|---|---|
AMT |
1 – 10 000 |
ex, ey, hx, hy |
natural |
sensitive |
MT |
1e-4 – 1000 |
ex, ey, hx, hy, hz |
natural |
sensitive |
CSAMT |
0.125 – 8192 |
ex, ey, hx, hy |
controlled |
sensitive |
CSEM |
0.01 – 100 |
ex, ey, hx, hy |
controlled |
sensitive |
TDEM / TEM |
(time-domain) |
hz |
controlled |
not sensitive |
The band edges are representative defaults, not hard standards; override them per survey when acquisition parameters differ. CSAMT’s own band (0.125–8192 Hz) is wider than the table’s rounded AMT/CSAMT row suggests, because it is a controlled-source method reaching lower into the sub-audio range than a purely natural-source AMT deployment would trust.
9.5.2. Target Bands By Decade#
That same band also drives
target_bands_for_method(), which breaks it
into per-decade sub-bands for the frequency coverage check that
AMT/CSAMT Edge Diagnostics introduced. Given a band \([f_{\mathrm{lo}},
f_{\mathrm{hi}}]\), the exponent range rounds outward to whole decades,
giving decade edges \(10^{k_{\mathrm{lo}}}, 10^{k_{\mathrm{lo}}+1}, \dots, 10^{k_{\mathrm{hi}}}\). The first and last of those edges are then snapped back to the true band limits, \(f_{\mathrm{lo}}\) and \(f_{\mathrm{hi}}\), so a band edge that does not sit on a round decade — CSAMT’s 0.125 Hz, for instance — still produces a band whose own edge is the true limit rather than a rounded-down 0.1 Hz. TDEM/TEM has no defined frequency band, so it returns an empty list rather than a spurious coverage target:
>>> from pycsamt.iot import target_bands_for_method
>>> for method in ("amt", "csamt", "tdem"):
...     print(f"{method}: {target_bands_for_method(method)}")
amt: [(1.0, 10.0), (10.0, 100.0), (100.0, 1000.0), (1000.0, 10000.0)]
csamt: [(0.125, 1.0), (1.0, 10.0), (10.0, 100.0), (100.0, 1000.0), (1000.0, 8192.0)]
tdem: []
AMT’s band rounds outward to whole decades on both ends already (1 Hz and 10 000 Hz), so its four target bands line up on round numbers. CSAMT’s first band starts at 0.125 Hz rather than 0.1 Hz, and its last band ends at 8192 Hz rather than 10 000 Hz — exactly the clamping described above, carrying the profile’s true edges through instead of a decade that would overstate the method’s real coverage.
9.5.3. Seeding A Monitor#
for_method() seeds the
expected band and required channels from a profile, so the
method-mismatch, missing-channel, and out-of-band checks in
TelemetryMonitor become method-aware
with no manual tuning. Keyword overrides win over the profile defaults.
The packet below is deliberately wrong for a CSAMT monitor — it reports
method="mt" and is missing hy — to show what that
method-awareness actually catches:
>>> from pycsamt.iot import (
...     DeviceConfig, MonitoringConfig, PacketKind, TelemetryPacket,
...     assess_telemetry,
... )
>>> device = DeviceConfig(
...     "csamt-node-01", station="S01", protocol="mqtt",
...     channels=["ex", "ey", "hx", "hy"],
... )
>>> mt_packet = TelemetryPacket.from_device(
...     device, timestamp=1_700_000_000.0,
...     payload={
...         "method": "mt",                  # wrong method for this monitor
...         "station": "S01",
...         "channels": ["ex", "ey", "hx"],  # hy missing
...         "battery_v": 12.3,
...     },
...     kind=PacketKind.QC,
... )
>>> cfg = MonitoringConfig.for_method("csamt", min_battery_v=11.5)
>>> status = assess_telemetry([mt_packet], config=cfg)
>>> print(f"level: {status.level.value}")
level: critical
>>> print(f"issues: {status.issues}")
issues: ['method_mismatch', 'required_channels_missing']
Both issues trace directly back to the CSAMT profile pulled in by
for_method: it expects method="csamt" and all four of ex, ey,
hx, hy, and the packet above deliberately violates both. A packet that
actually reported method="csamt" with all four channels would clear
both checks against the very same cfg — nothing about the monitor
changes between the two cases, only what the telemetry reports about
itself.
9.5.4. Method-Aware Edge QC#
Passing method to amt_edge_report() gates
the edge diagnostics by method. Powerline-harmonic detection runs
only for powerline-sensitive methods — it is skipped for
TDEM/TEM, where the report carries powerline_applicable=False
instead of a misleading “clean” verdict — and frequency coverage
is scored against the method’s target bands from the section above. The
same synthetic window, contaminated with a 50 Hz mains harmonic, is run
through both an AMT and a TDEM context below so the difference is visible
directly:
>>> import numpy as np
>>> from pycsamt.iot import amt_edge_report
>>> sample_rate = 2048.0
>>> n_samples = 8192
>>> t = np.arange(n_samples) / sample_rate
>>> rng = np.random.default_rng(3)
>>> window = (
...     0.9 * np.sin(2 * np.pi * 3.0 * t)
...     + 0.8 * np.sin(2 * np.pi * 12.0 * t)
...     + 0.7 * np.sin(2 * np.pi * 45.0 * t)
...     + 0.6 * np.sin(2 * np.pi * 90.0 * t)
...     + 0.5 * np.sin(2 * np.pi * 50.0 * t)    # mains contamination
...     + 0.05 * rng.standard_normal(n_samples)
... )
>>> report_amt = amt_edge_report(window, sample_rate, method="amt")
>>> report_tdem = amt_edge_report(window, sample_rate, method="tdem")
>>> print(
...     f"AMT  powerline_applicable: {report_amt['powerline_applicable']}, "
...     f"contaminated: {report_amt['powerline']['contaminated']}"
... )
AMT  powerline_applicable: True, contaminated: True
>>> print(
...     f"TDEM powerline_applicable: {report_tdem['powerline_applicable']}, "
...     f"powerline: {report_tdem['powerline']}"
... )
TDEM powerline_applicable: False, powerline: None
>>> print(
...     f"AMT  coverage_fraction: {report_amt['frequency_coverage']['coverage_fraction']:.2f}, "
...     f"missing_bands: {report_amt['frequency_coverage']['missing_bands']}"
... )
AMT  coverage_fraction: 0.25, missing_bands: [[1.0, 10.0], [100.0, 1000.0], [1000.0, 10000.0]]
>>> print(f"TDEM coverage_fraction: {report_tdem['frequency_coverage']['coverage_fraction']}")
TDEM coverage_fraction: nan
Only one of AMT’s four target decades — 10–100 Hz — is where this window
actually has resolvable energy, so coverage_fraction lands on exactly
0.25 and the other three decades come back as missing. The TDEM context
skips the powerline check entirely (powerline: None, not
contaminated: False — the check never ran rather than running and
passing) and its coverage fraction is nan rather than a number,
because target_bands_for_method() returned an
empty list for a method with no frequency band to score against.
The figure below makes the AMT row concrete. It reuses
compute_live_spectra() from
AMT/CSAMT Edge Diagnostics and shades each of the four target decades by
whether frequency_coverage reported it as covered or missing:
>>> from pathlib import Path
>>> import matplotlib.pyplot as plt
>>> from pycsamt.iot import compute_live_spectra, target_bands_for_method
>>> out_dir = Path("docs/source/images/user_guide/iot")
>>> out_dir.mkdir(parents=True, exist_ok=True)
>>> spectra = compute_live_spectra(window, sample_rate)
>>> freq = spectra["frequency_hz"]
>>> psd = spectra["psd"]
>>> target_bands = target_bands_for_method("amt")
>>> missing_bands = {tuple(b) for b in report_amt["frequency_coverage"]["missing_bands"]}
>>> fig, ax = plt.subplots(figsize=(9.5, 5.2), constrained_layout=True)
>>> for lo, hi in target_bands:
...     color = "tab:red" if (lo, hi) in missing_bands else "tab:green"
...     _ = ax.axvspan(lo, hi, color=color, alpha=0.15)
>>> _ = ax.plot(freq[1:], psd[1:], color="tab:blue", lw=1.3)
>>> _ = ax.axvline(50.0, color="0.25", ls="--", lw=1.2, label="50 Hz mains")
>>> ax.set_xscale("log")
>>> ax.set_yscale("log")
>>> _ = ax.set_xlim(1.0, 400.0)
>>> _ = ax.set_xlabel("Frequency (Hz)")
>>> _ = ax.set_ylabel("PSD")
>>> _ = ax.set_title("AMT target decades vs. recovered spectrum (green = covered, red = missing)")
>>> _ = ax.legend(loc="upper right")
>>> fig.savefig(out_dir / "user-guide-iot-method-profiles-01.png", dpi=170)
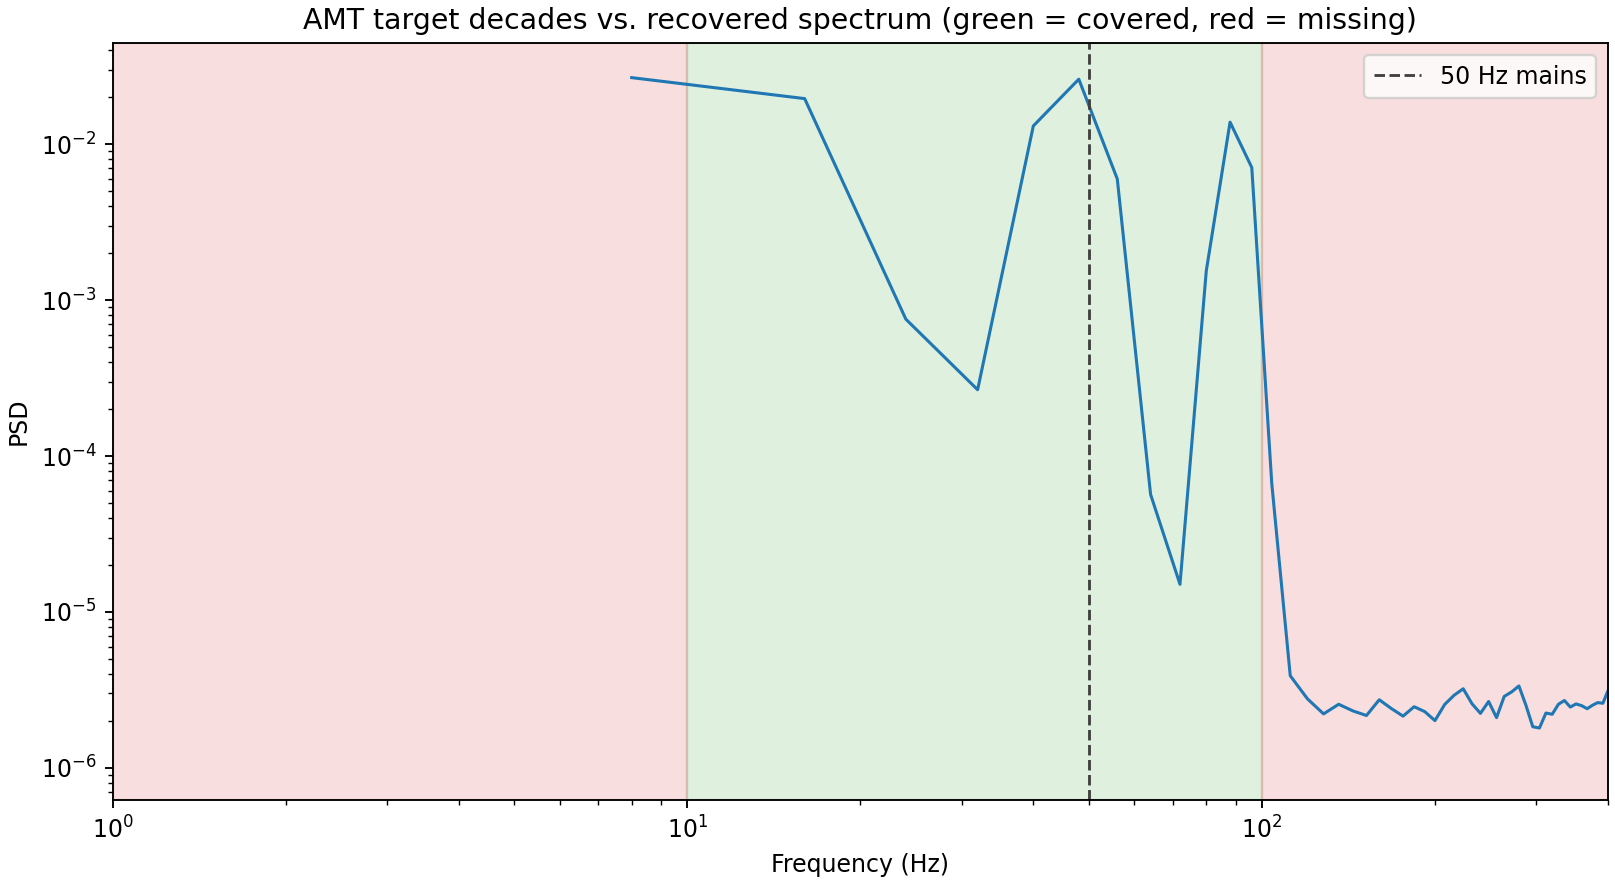
The window’s recovered spectrum only clears the noise floor across
roughly 10–100 Hz — the one target decade shaded green, against the
three shaded red — and the 50 Hz mains line sits squarely inside that
covered band, which is exactly why contaminated came back True:
the very energy that makes coverage_fraction a middling 0.25 is also
what put a mains harmonic somewhere the powerline detector could see it.
A TDEM context would skip this whole comparison, since a transient decay
has no steady-state spectrum for a 50 Hz line to contaminate. Passing no
method at all preserves the original, method-agnostic behaviour: no
target bands are imposed, and powerline detection always runs — the
per-method gating shown here is strictly additive, not a change to the
default when a survey has no declared method yet.