
5.2. Extracting Station Topography#
The previous page built chain_km and elev_m for the L18PLT
line by calling extract_chainage() and
extract_elevation() directly on a list of
EDIFile objects. That list is only one of
several station containers pyCSAMT passes around – a
EDICollection, a
Sites instance, or an
EDIBatch all show up in different parts
of the codebase – and pycsamt.topo.extract is the layer that
makes the rest of pycsamt.topo indifferent to which one it was
handed.
5.2.1. Any container, one answer#
Internally, each extraction function funnels its input through the
same private iterator, which checks in order for a ._items
attribute (Sites and
EDICollection both store their
stations this way), then for edi_objects_/_edis/edis/
edi_files (the attribute names used by
EDIBatch), then falls back to treating
the input as a plain iterable, and finally as a single EDI-like object
if nothing else matched. Wrapping the same L18PLT stations in three
different containers confirms the outputs agree exactly:
>>> from pycsamt.seg.collection import EDICollection
>>> from pycsamt.site.base import Sites
>>> from pycsamt.topo import extract_chainage, extract_elevation

>>> coll = EDICollection(sites)
>>> sites_obj = Sites(sites)

>>> import numpy as np
>>> np.array_equal(extract_elevation(sites), extract_elevation(coll))
True
>>> np.array_equal(extract_elevation(sites), extract_elevation(sites_obj))
True
>>> np.allclose(extract_chainage(sites), extract_chainage(coll))
True
>>> np.allclose(extract_chainage(sites), extract_chainage(sites_obj))
True
sites here is still the plain list from Terrain-Following Coordinates. A
Sites object built from it,
Sites(sites), and an EDICollection
built from it, EDICollection(sites), both funnel through the same
._items path and produce identical arrays – code written against
one container type keeps working if a caller upstream switches to
another.
The adapter reaches back further than pyCSAMT’s own current classes,
too: it also recognizes the older MTpy-style .Head attribute (as
opposed to EDIFile’s .sections["head"]
dictionary), so legacy EDI wrappers work without modification:
>>> from pycsamt.topo import extract_elevation, extract_station_names, has_elevation

>>> class _OldHead:
...     elev = 0.0
...     lat = 10.0
...     lon = 20.0
...     dataid = "LEGACY01"
>>> class _OldEDI:
...     Head = _OldHead()

>>> legacy_sites = [_OldEDI(), _OldEDI(), _OldEDI()]
>>> extract_station_names(legacy_sites)
['LEGACY01', 'LEGACY01', 'LEGACY01']
Station names fall back the same way when nothing usable is found at
all – extract_station_names never raises for a missing name, it
assigns f"S{i:03d}" in collection order instead, which is what lets
Terrain Overlays on Section Axes always have something to put on a station label even
for a container with no metadata.
5.2.2. Knowing when there is nothing to drape#
The three synthetic stations above share one real problem: their
elevation is 0.0, which is indistinguishable from “no elevation was
recorded” without a convention. has_elevation()
and extract_elevation() share that
convention – an elevation array that is all zero is treated as
missing, not as a genuine sea-level survey – and warn rather than
silently drape a flat line as if it were real terrain:
>>> import warnings
>>> has_elevation(legacy_sites)
False
>>> with warnings.catch_warnings(record=True) as caught:
...     warnings.simplefilter("always")
...     elev = extract_elevation(legacy_sites)
>>> elev
array([0., 0., 0.])
>>> str(caught[0].message)
"No non-zero elevation data found in the station collection. Topography will appear flat (all zeros).  Set topography via Sites.with_topography() or configure_topo(source='array', elev_array=...)."
The warning is a hint, not an error, because a genuinely flat survey
line is a legitimate input; the function still returns the all-zero
array so calling code keeps working, it just cannot assume the zeros
mean “sea level” without checking. with_topography()
and configure_topo(source="array", elev_array=...) are the two
routes the message points to for supplying elevation from outside the
EDI files themselves, when a survey was not logged with GPS elevation
at all.
Plotting extract_chainage/extract_elevation directly, before
any draping happens, is a useful sanity check on its own – it is the
same profile that reappeared as the black terrain line in the previous
page’s figure, now on its own axis. There is no dedicated
plot_elevation_profile helper in pycsamt.topo – the arrays
are two (n_stations,) vectors, plain enough that a few lines of
Matplotlib are clearer than a wrapper would be:
>>> import matplotlib.pyplot as plt
>>> from pycsamt.topo import extract_station_names

>>> names = extract_station_names(sites)
>>> fig, ax = plt.subplots(figsize=(9.5, 3.6), constrained_layout=True)
>>> _ = ax.plot(chain_km, elev_m, color="#6b4e2a", linewidth=1.3, zorder=2)
>>> _ = ax.scatter(
...     chain_km, elev_m, marker="v", s=32,
...     facecolors="black", edgecolors="black", zorder=3,
... )
>>> for i in range(0, len(names), 4):
...     _ = ax.annotate(
...         names[i].replace("23-18-", ""), (chain_km[i], elev_m[i]),
...         textcoords="offset points", xytext=(0, 8), fontsize=7,
...         ha="center", rotation=90,
...     )
>>> _ = ax.set_xlabel("Station distance (km)")
>>> _ = ax.set_ylabel("Elevation (m a.s.l.)")
>>> _ = ax.set_title("L18PLT station elevation profile", pad=14)
>>> _ = ax.set_ylim(elev_m.min() - 10, elev_m.max() + 45)
>>> ax.margins(x=0.02)
>>> fig.savefig("extract_l18_elevation_profile.png", dpi=170, bbox_inches="tight")
Every fourth station is labelled (names[i].replace("23-18-", "")
keeps only the short suffix – the full dataid values share the
"23-18-" survey/line prefix seen in Terrain-Following Coordinates) so the axis
stays readable instead of stacking 28 vertical labels on top of each
other; the extra headroom from set_ylim keeps them clear of the
title:
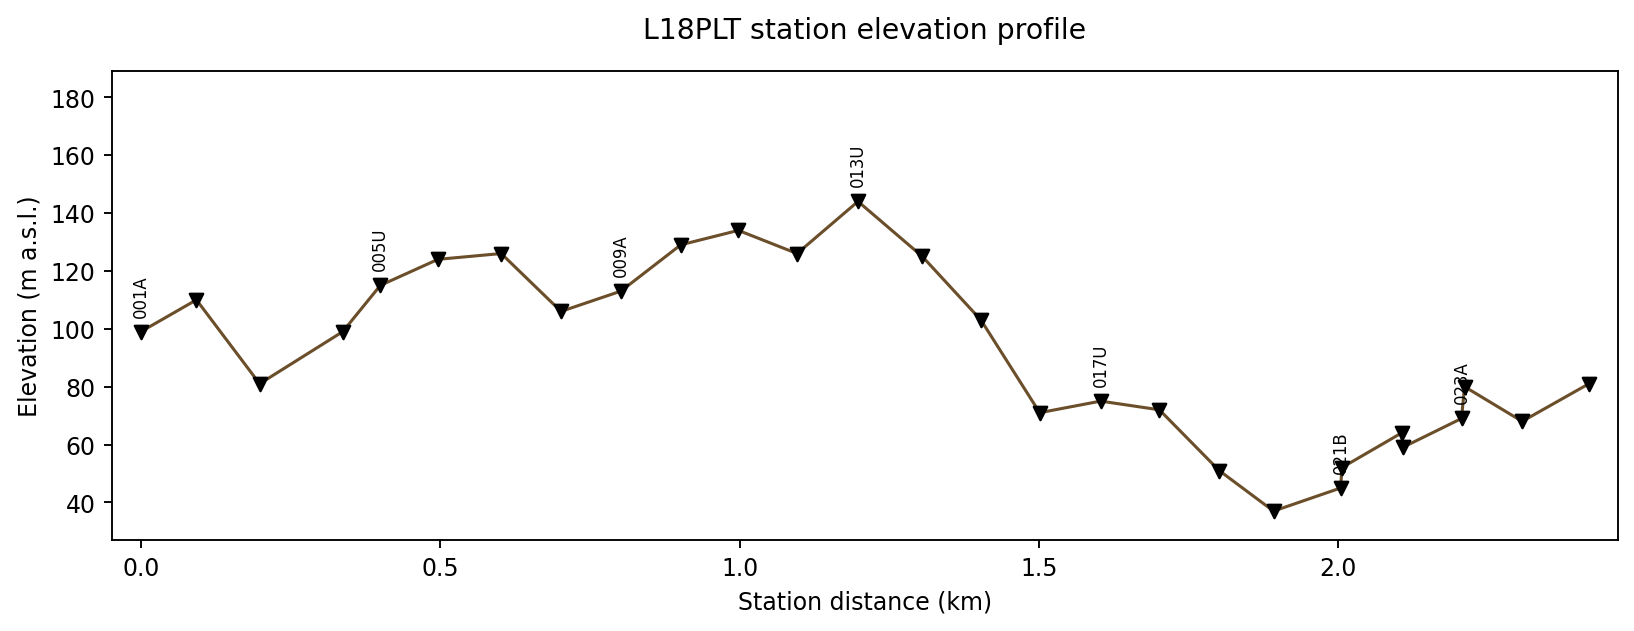
L18PLT elevation against extract_chainage()’s
station distance. The profile is not monotonic: it climbs from
station 001A to a local high near 013U around 1.2 km, then drops
almost 110 m over the next kilometre before recovering slightly
toward the end of the line. That drop is the same one that pulled
the draped anomaly downward on the right-hand side of
Terrain-Following Coordinates’s comparison figure – reading the raw elevation
profile first makes it easier to recognize which part of a later
draped section is a real terrain effect.#
With chain_km and elev_m reliably extracted regardless of
container type, Draping Flat Grids Over Terrain covers what
interp_elev() and
drape_section() actually do with them –
including why the depth grid needs values interpolated at cell
centres rather than reusing the station positions directly.